QUESTION IMAGE
Question
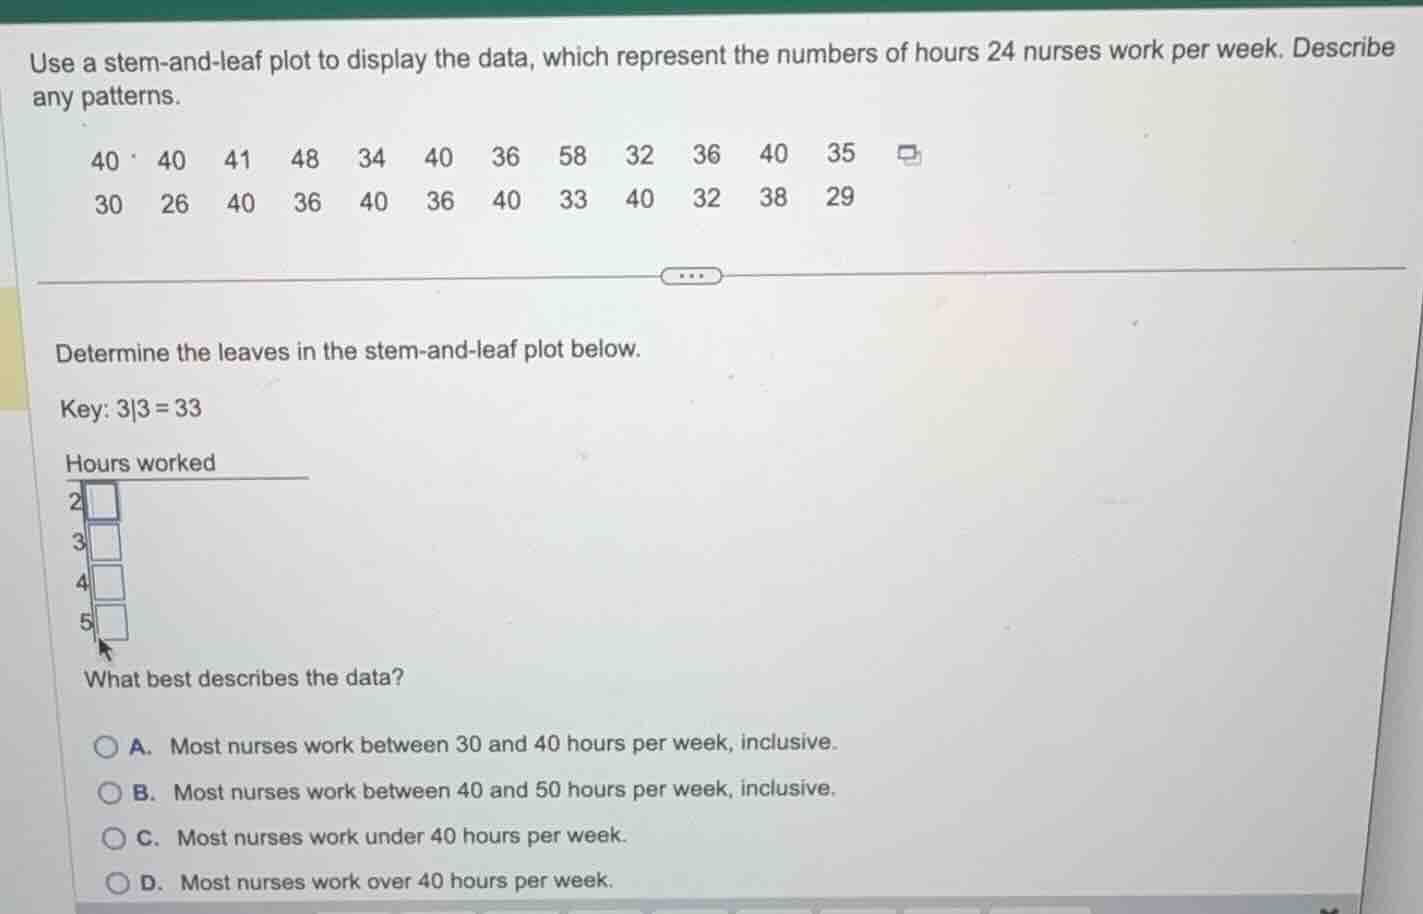
use a stem-and-leaf plot to display the data, which represent the numbers of hours 24 nurses work per week. describe any patterns.
40 40 41 48 34 40 36 58 32 36 40 35
30 26 40 36 40 36 40 33 40 32 38 29
determine the leaves in the stem-and-leaf plot below.
key: 3|3 = 33
hours worked
2
3
4
5
what best describes the data?
a. most nurses work between 30 and 40 hours per week, inclusive.
b. most nurses work between 40 and 50 hours per week, inclusive.
c. most nurses work under 40 hours per week.
d. most nurses work over 40 hours per week.
Sort the raw data by stems
$$
LATEXBLOCK0
$$
Identify the correct leaves for each stem
$$
LATEXBLOCK1
$$
Analyze the distribution to describe the data
$$
LATEXBLOCK2
$$

Snap & solve any problem in the app
Get step-by-step solutions on Sovi AI
Photo-based solutions with guided steps
Explore more problems and detailed explanations
Question 1
The leaves in the stem-and-leaf plot are:
- 2: 6, 9
- 3: 0, 2, 2, 3, 4, 5, 6, 6, 6, 6, 8
- 4: 0, 0, 0, 0, 0, 0, 0, 0, 1, 8
- 5: 8
Question 2
- A. Most nurses work between 30 and 40 hours per week, inclusive. (Correct answer)
- B. Most nurses work between 40 and 50 hours per week, inclusive.
- C. Most nurses work under 40 hours per week.
- D. Most nurses work over 40 hours per week.