QUESTION IMAGE
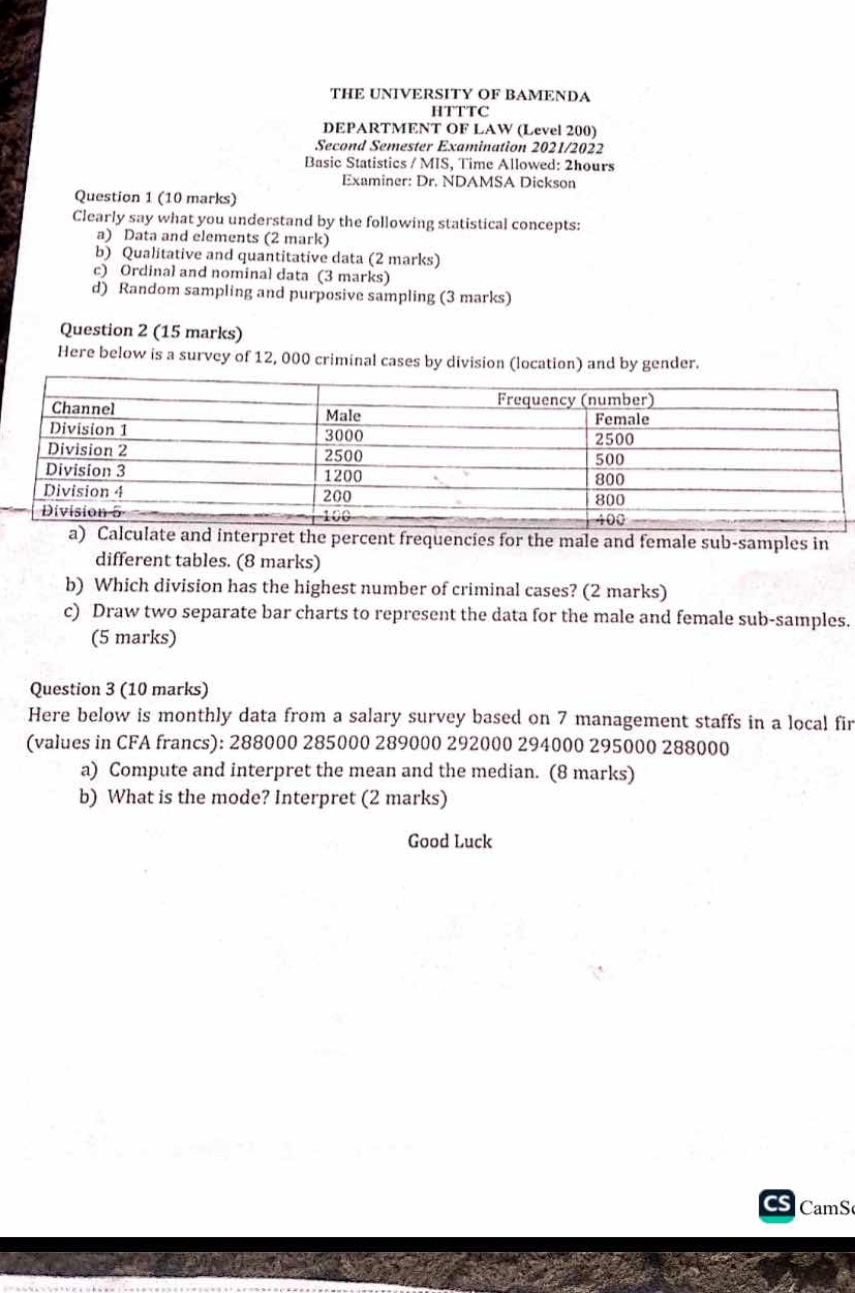
Question
the university of bamenda
htttc
department of law (level 200)
second semester examination 2021/2022
basic statistics / mis, time allowed: 2hours
examiner: dr. ndamsa dickson
question 1 (10 marks)
clearly say what you understand by the following statistical concepts:
a) data and elements (2 mark)
b) qualitative and quantitative data (2 marks)
c) ordinal and nominal data (3 marks)
d) random sampling and purposive sampling (3 marks)
question 2 (15 marks)
here below is a survey of 12, 000 criminal cases by division (location) and by gender.
\
a) calculate and interpret the percent frequencies for the male and female sub-samples in different tables. (8 marks)
b) which division has the highest number of criminal cases? (2 marks)
c) draw two separate bar charts to represent the data for the male and female sub-samples. (5 marks)
question 3 (10 marks)
here below is monthly data from a salary survey based on 7 management staffs in a local firm (values in cfa francs): 288000 285000 289000 292000 294000 295000 288000
a) compute and interpret the mean and the median. (8 marks)
b) what is the mode? interpret (2 marks)
good luck
Define statistical concepts
- Data: Facts, figures, or values collected for analysis.
- Elements: The individual entities or subjects from which data are collected.
- Qualitative data: Non-numerical attributes or categories (e.g., gender, division).
- Quantitative data: Numerical values representing counts or measurements (e.g., case counts, salaries).
- Nominal data: Categorical data with no inherent order (e.g., division names).
- Ordinal data: Categorical data with a meaningful order or rank (e.g., education levels).
- Random sampling: A method where every member of the population has an equal chance of selection.
- Purposive sampling: A non-probability method where elements are selected based on the researcher's judgment.
Analyze criminal cases by division and gender
- Male sub-sample total:
- Female sub-sample total:
- Percent frequencies (Male):
- Division 1: \(\frac{3000}{7000} \times 100\% \approx 42.86\%\)
- Division 2: \(\frac{2500}{7000} \times 100\% \approx 35.71\%\)
- Division 3: \(\frac{1200}{7000} \times 100\% \approx 17.14\%\)
- Division 4: \(\frac{200}{7000} \times 100\% \approx 2.86\%\)
- Division 5: \(\frac{100}{7000} \times 100\% \approx 1.43\%\)
- Percent frequencies (Female):
- Division 1: \(\frac{2500}{5000} \times 100\% = 50.00\%\)
- Division 2: \(\frac{500}{5000} \times 100\% = 10.00\%\)
- Division 3: \(\frac{800}{5000} \times 100\% = 16.00\%\)
- Division 4: \(\frac{800}{5000} \times 100\% = 16.00\%\)
- Division 5: \(\frac{400}{5000} \times 100\% = 8.00\%\)
- Total cases per division:
- Division 1: \(3000 + 2500 = 5500\)
- Division 2: \(2500 + 500 = 3000\)
- Division 3: \(1200 + 800 = 2000\)
- Division 4: \(200 + 800 = 1000\)
- Division 5: \(100 + 400 = 500\)
Compute salary statistics
- Data set: \(288000, 285000, 289000, 292000, 294000, 295000, 288000\)
- Mean:
- Ordered data: \(285000, 288000, 288000, 289000, 292000, 294000, 295000\)
- Median: Middle value (4th value) = \(289000 \text{ CFA francs}\)
- Mode: Most frequent value = \(288000 \text{ CFA francs}\) (occurs twice)

Snap & solve any problem in the app
Get step-by-step solutions on Sovi AI
Photo-based solutions with guided steps
Explore more problems and detailed explanations
Question 1
a) Data and elements: Data are the facts, figures, and values collected, analyzed, and summarized. Elements are the individual entities or subjects from which the data are collected.
b) Qualitative and quantitative data: Qualitative data consist of labels or names used to identify attributes of each element (non-numerical). Quantitative data consist of numerical values that indicate how much or how many.
c) Ordinal and nominal data: Nominal data are categorical data with no natural ordering or ranking (e.g., gender). Ordinal data are categorical data that have a meaningful order or rank (e.g., satisfaction level).
d) Random sampling and purposive sampling: Random sampling is a probability sampling method where every member of the population has an equal, non-zero chance of being selected. Purposive sampling is a non-probability sampling method where elements are selected based on the researcher's judgment and the purpose of the study.
---
Question 2
a) Percent Frequencies
Male Sub-sample (\(N = 7000\))
| Division | Frequency | Percent Frequency |
|---|---|---|
| Division 2 | 2500 | 35.71% |
| Division 3 | 1200 | 17.14% |
| Division 4 | 200 | 2.86% |
| Division 5 | 100 | 1.43% |
Female Sub-sample (\(N = 5000\))
| Division | Frequency | Percent Frequency |
|---|---|---|
| Division 2 | 500 | 10.00% |
| Division 3 | 800 | 16.00% |
| Division 4 | 800 | 16.00% |
| Division 5 | 400 | 8.00% |
Interpretation: Division 1 has the highest concentration of criminal cases for both males (42.86%) and females (50.00%). Division 5 has the lowest concentration for both sub-samples.
b) Highest Criminal Cases
Division 1 has the highest number of criminal cases with a total of \(5500\) cases (\(3000\) male, \(2500\) female).
c) Bar Charts
(Visualized in the plot below)
---
Question 3
a) Mean and Median
- Mean: \(290,142.86 \text{ CFA francs}\).
Interpretation: The average monthly salary of the 7 management staff members is approximately \(290,142.86 \text{ CFA francs}\).
- Median: \(289,000 \text{ CFA francs}\).
Interpretation: Exactly half of the staff earn less than or equal to \(289,000 \text{ CFA francs}\), and the other half earn more.
b) Mode
- Mode: \(288,000 \text{ CFA francs}\).
Interpretation: The most common monthly salary among the surveyed management staff is \(288,000 \text{ CFA francs}\).