QUESTION IMAGE
Question
type the correct answer in each box. spell all words correctly, and use numerals instead of words for numbers. if necessary, use / for the fraction bar(s).
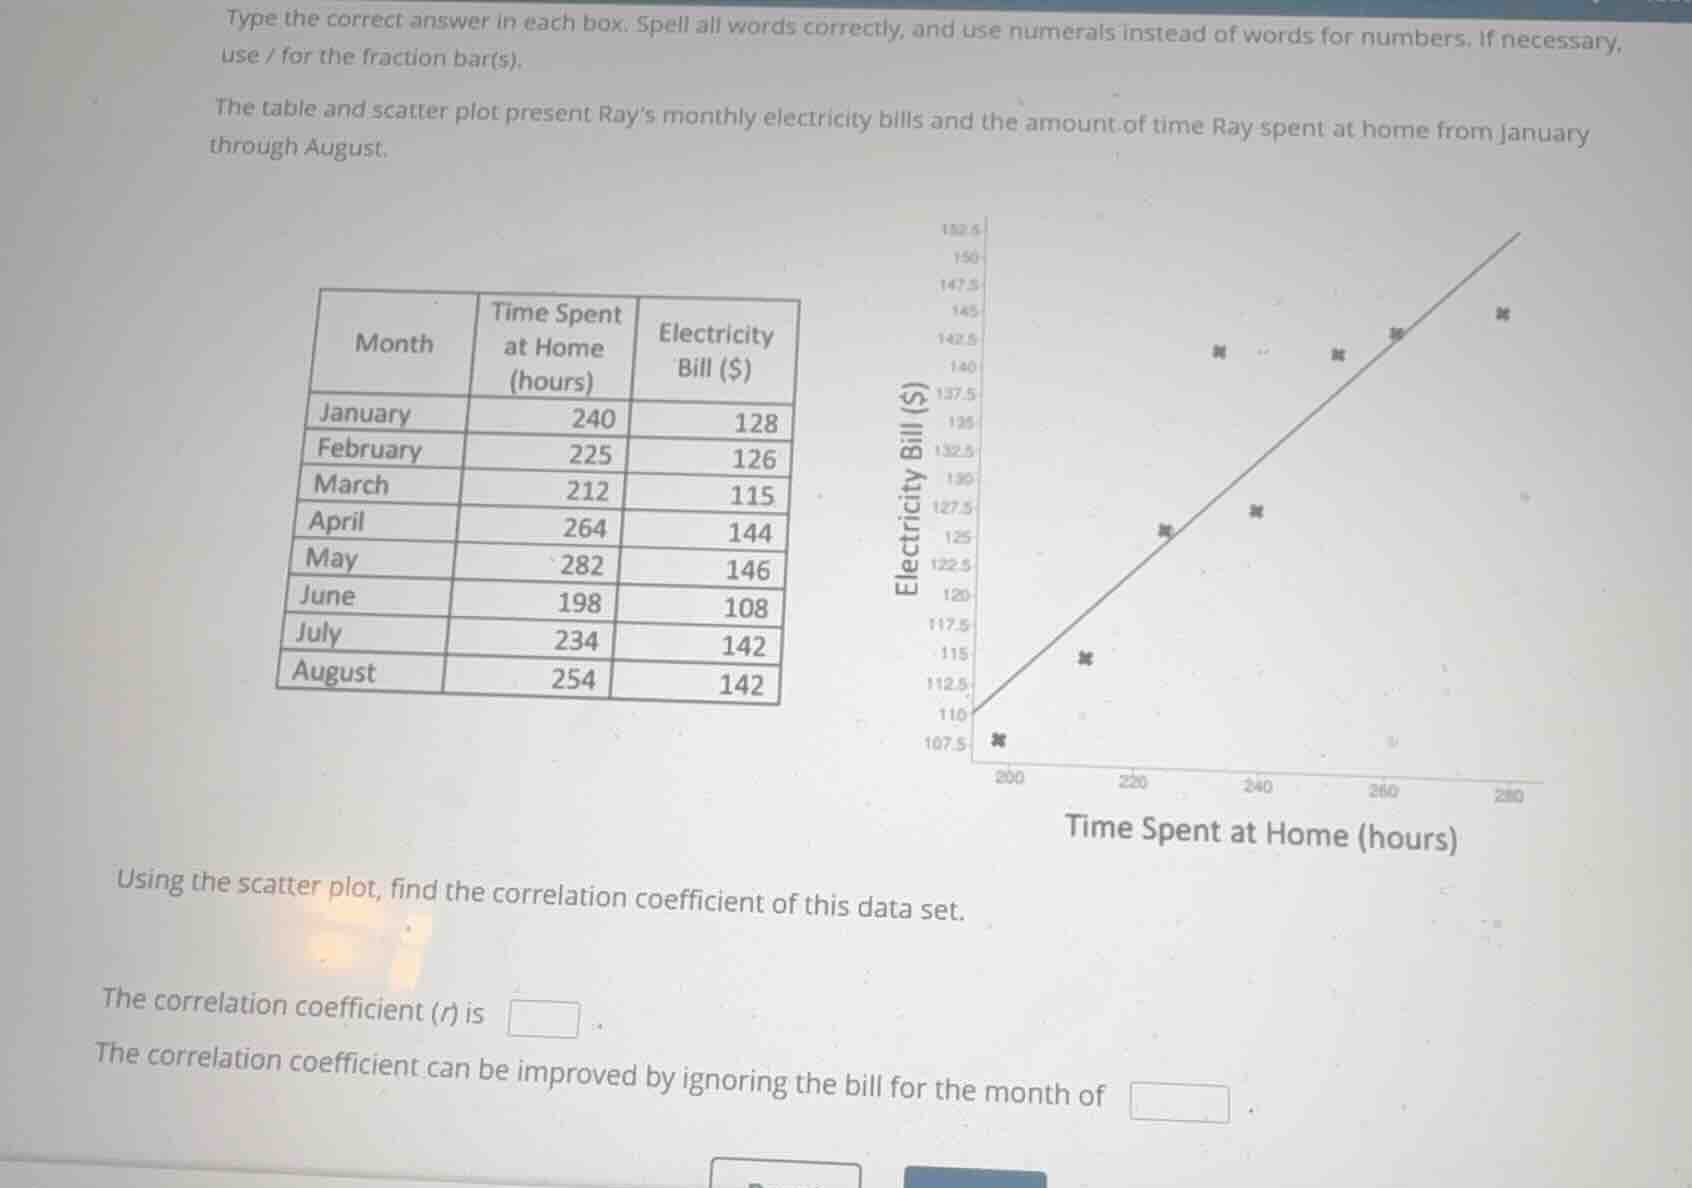
the table and scatter plot present rays monthly electricity bills and the amount of time ray spent at home from january through august.
\
using the scatter plot, find the correlation coefficient of this data set.
the correlation coefficient (r) is .
the correlation coefficient can be improved by ignoring the bill for the month of .
Calculate the correlation coefficient (r)
Identify the outlier month

Snap & solve any problem in the app
Get step-by-step solutions on Sovi AI
Photo-based solutions with guided steps
Explore more problems and detailed explanations
Question 1
The correlation coefficient (\(r\)) is <blank>0.65</blank>.
Question 2
The correlation coefficient can be improved by ignoring the bill for the month of <blank>July</blank>.