QUESTION IMAGE
Question
type the correct answer in the box. use numerals instead of words. if necessary, use / for the fraction bar.
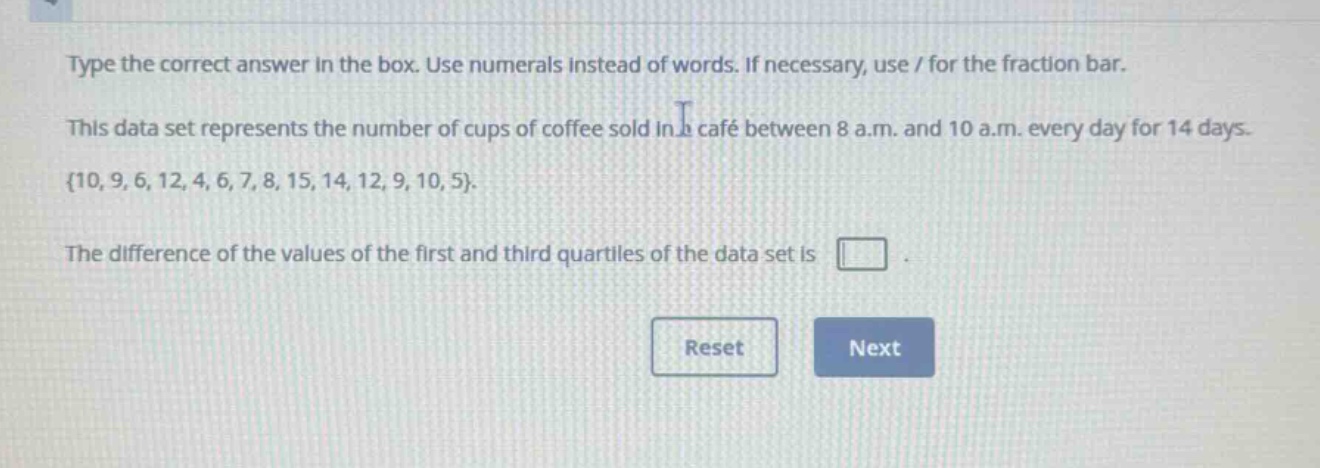
this data set represents the number of cups of coffee sold in a café between 8 a.m. and 10 a.m. every day for 14 days.
\\{10, 9, 6, 12, 4, 6, 7, 8, 15, 14, 12, 9, 10, 5\\}.
the difference of the values of the first and third quartiles of the data set is .
⚡ Using what you learned: Interquartile Range (IQR)
Step 1: Order the data set
Arrange the 14 data points in ascending order:
Step 2: Find the median (Q2)
Since there are 14 data points, the median is the average of the 7th and 8th values:
This splits the data into two halves:
- Lower half (first 7 values): \( \{4, 5, 6, 6, 7, 8, 9\} \)
- Upper half (last 7 values): \( \{9, 10, 10, 12, 12, 14, 15\} \)
Step 3: Find the first quartile (Q1) and third quartile (Q3)
The first quartile (\( Q_1 \)) is the median of the lower half:
The third quartile (\( Q_3 \)) is the median of the upper half:
Step 4: Calculate the difference (IQR)
Subtract \( Q_1 \) from \( Q_3 \):

Snap & solve any problem in the app
Get step-by-step solutions on Sovi AI
Photo-based solutions with guided steps
Explore more problems and detailed explanations
6