QUESTION IMAGE
Question
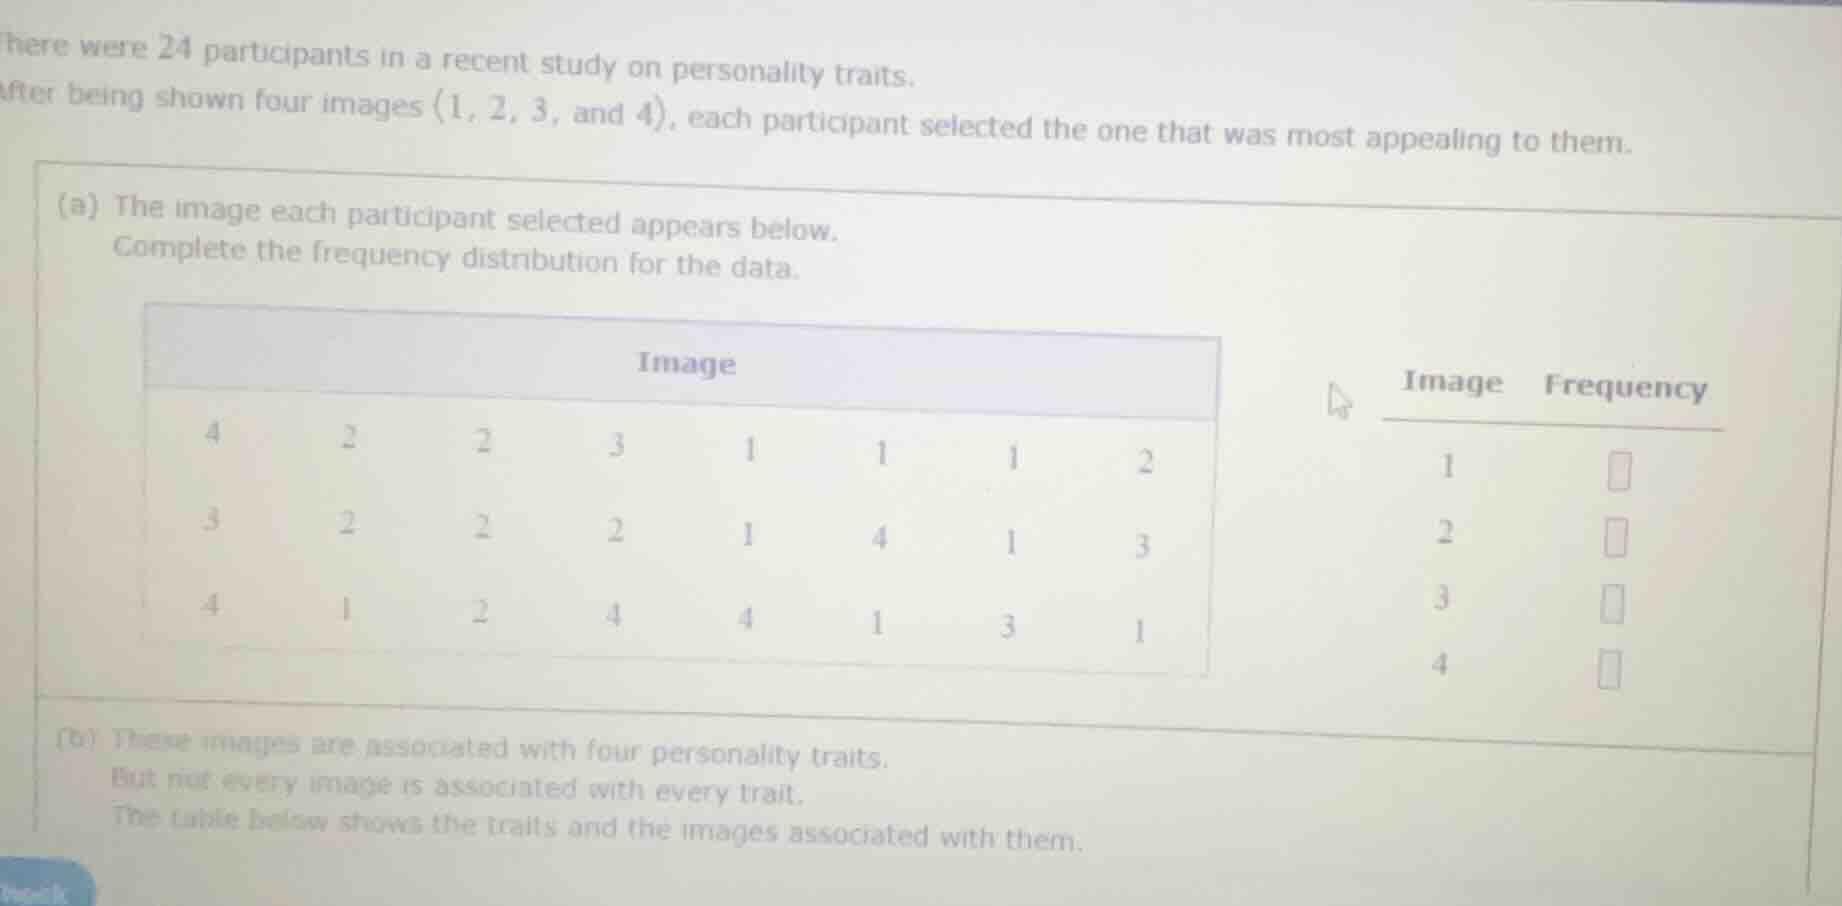
there were 24 participants in a recent study on personality traits.
after being shown four images (1, 2, 3, and 4), each participant selected the one that was most appealing to them.
(a) the image each participant selected appears below.
complete the frequency distribution for the data.
image
4 2 2 3 1 1 1 2
3 2 2 2 1 4 1 3
4 1 2 4 4 1 3 1
image frequency
1
2
3
4
(b) these images are associated with four personality traits.
but not every image is associated with every trait.
the table below shows the traits and the images associated with them.
Count occurrences of each image
We count the occurrences of each number in the given \(3 \times 8\) grid of data:
- Row 1: 4, 2, 2, 3, 1, 1, 1, 2
- Row 2: 3, 2, 2, 2, 1, 4, 1, 3
- Row 3: 4, 1, 2, 4, 4, 1, 3, 1
Let's count each value:
- Value 1:
- Row 1: three 1s (positions 5, 6, 7)
- Row 2: two 1s (positions 5, 7)
- Row 3: three 1s (positions 2, 6, 8)
- Total for 1 = \(3 + 2 + 3 = 8\)
- Value 2:
- Row 1: three 2s (positions 2, 3, 8)
- Row 2: three 2s (positions 2, 3, 4)
- Row 3: one 2 (position 3)
- Total for 2 = \(3 + 3 + 1 = 7\)
- Value 3:
- Row 1: one 3 (position 4)
- Row 2: two 3s (positions 1, 8)
- Row 3: one 3 (position 7)
- Total for 3 = \(1 + 2 + 1 = 4\)
- Value 4:
- Row 1: one 4 (position 1)
- Row 2: one 4 (position 6)
- Row 3: three 4s (positions 1, 4, 5)
- Total for 4 = \(1 + 1 + 3 = 5\)
Verify total count
We sum the frequencies to ensure they equal the total number of participants:
This matches the 24 participants stated in the problem.

Snap & solve any problem in the app
Get step-by-step solutions on Sovi AI
Photo-based solutions with guided steps
Explore more problems and detailed explanations
Complete the frequency distribution for the data.
| Image | Frequency |
|---|---|
| 2 | <blank>7</blank> |
| 3 | <blank>4</blank> |
| 4 | <blank>5</blank> |