QUESTION IMAGE
Question
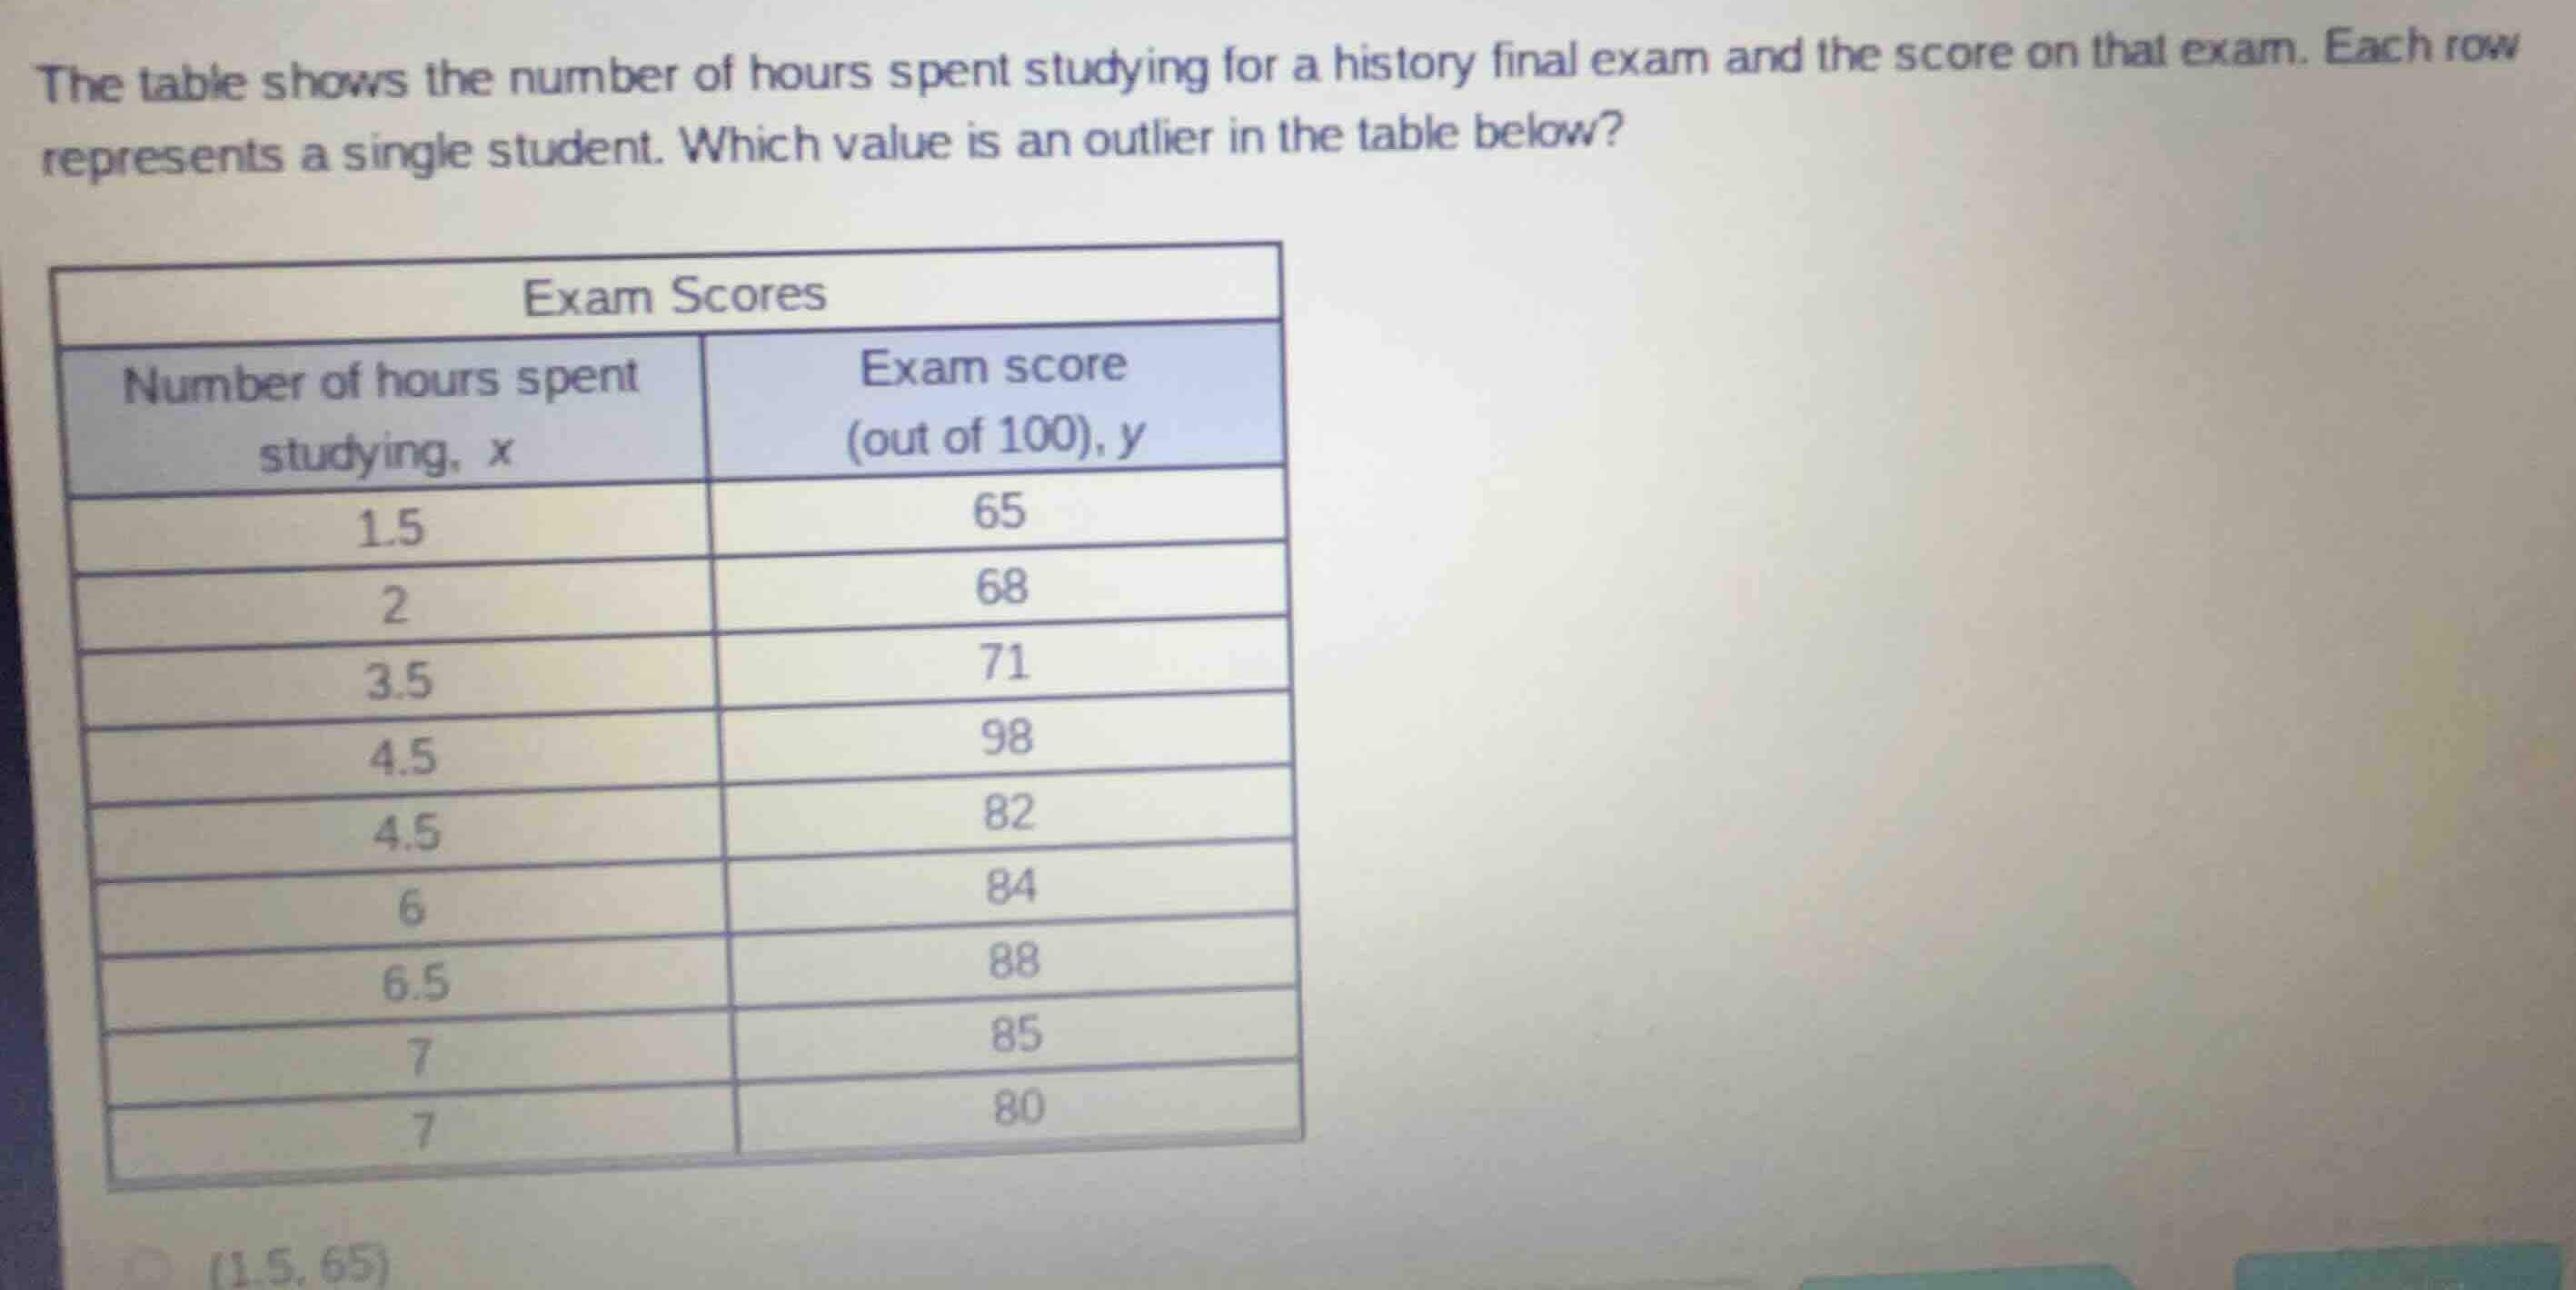
the table shows the number of hours spent studying for a history final exam and the score on that exam. each row represents a single student. which value is an outlier in the table below?
Analyze the general trend of the bivariate data
The data shows a general positive correlation between study hours \(x\) and exam score \(y\):
- For \(x = 1.5, 2, 3.5\), scores are in the range of \(65 - 71\).
- For \(x = 4.5, 6, 6.5, 7\), scores are mostly in the range of \(80 - 88\) (specifically \(82, 84, 88, 85, 80\)).
Identify the data point that deviates from the trend
Looking at the data points:
- \((1.5, 65)\) fits the lower-study, lower-score trend.
- \((2, 68)\) fits the trend.
- \((3.5, 71)\) fits the trend.
- \((4.5, 98)\) has an unusually high score of \(98\) compared to other students with similar study times (e.g., \(4.5\) hours with a score of \(82\), or \(6-7\) hours with scores of \(80-88\)).
- \((4.5, 82)\), \((6, 84)\), \((6.5, 88)\), \((7, 85)\), and \((7, 80)\) all cluster tightly around the \(80-88\) range.
Therefore, the point \((4.5, 98)\) is the outlier.

Snap & solve any problem in the app
Get step-by-step solutions on Sovi AI
Photo-based solutions with guided steps
Explore more problems and detailed explanations
- (1.5, 65)
- (4.5, 98) (Correct answer)
- (4.5, 82)
- (7, 80)