QUESTION IMAGE
Question
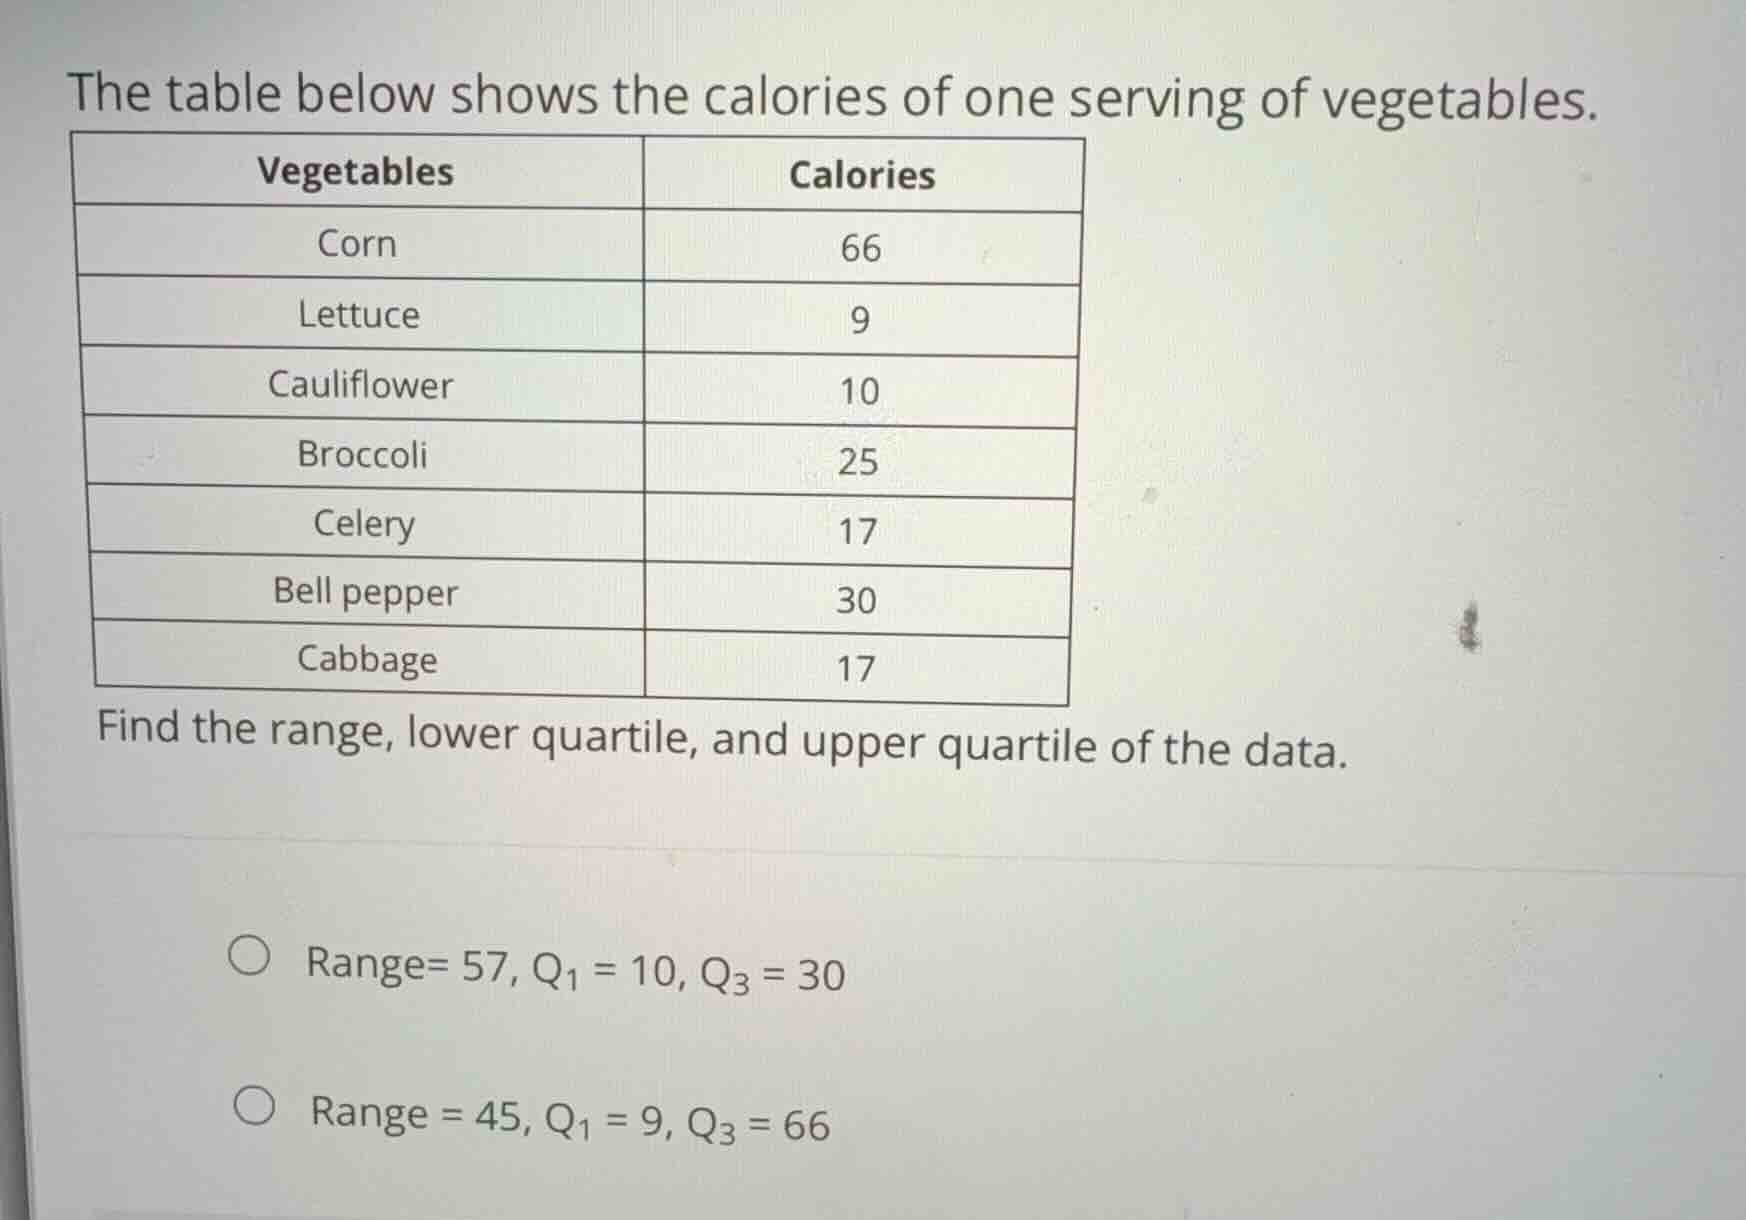
the table below shows the calories of one serving of vegetables.
find the range, lower quartile, and upper quartile of the data.
range = 57, q_1 = 10, q_3 = 30
range = 45, q_1 = 9, q_3 = 66
Order the dataset
Using the Ordering Numbers knowledge point
Calculate the range
Using the Range of Data knowledge point
Find the lower and upper quartiles
The median of the dataset \(9, 10, 17, 17, 25, 30, 66\) is the middle value:
The lower half of the data consists of the values below the median:
The lower quartile \(Q_1\) is the median of this lower half:
The upper half of the data consists of the values above the median:
The upper quartile \(Q_3\) is the median of this upper half:
Identify the correct option
The calculated values are:
This matches the first option.

Snap & solve any problem in the app
Get step-by-step solutions on Sovi AI
Photo-based solutions with guided steps
Explore more problems and detailed explanations
- (A) Range = 57, \(Q_1 = 10\), \(Q_3 = 30\) (Correct answer)
- (B) Range = 45, \(Q_1 = 9\), \(Q_3 = 66\)