QUESTION IMAGE
Question
a. symmetric distribution
b. negatively skewed distribution
c. positively skewed distribution
1.
2.
3.
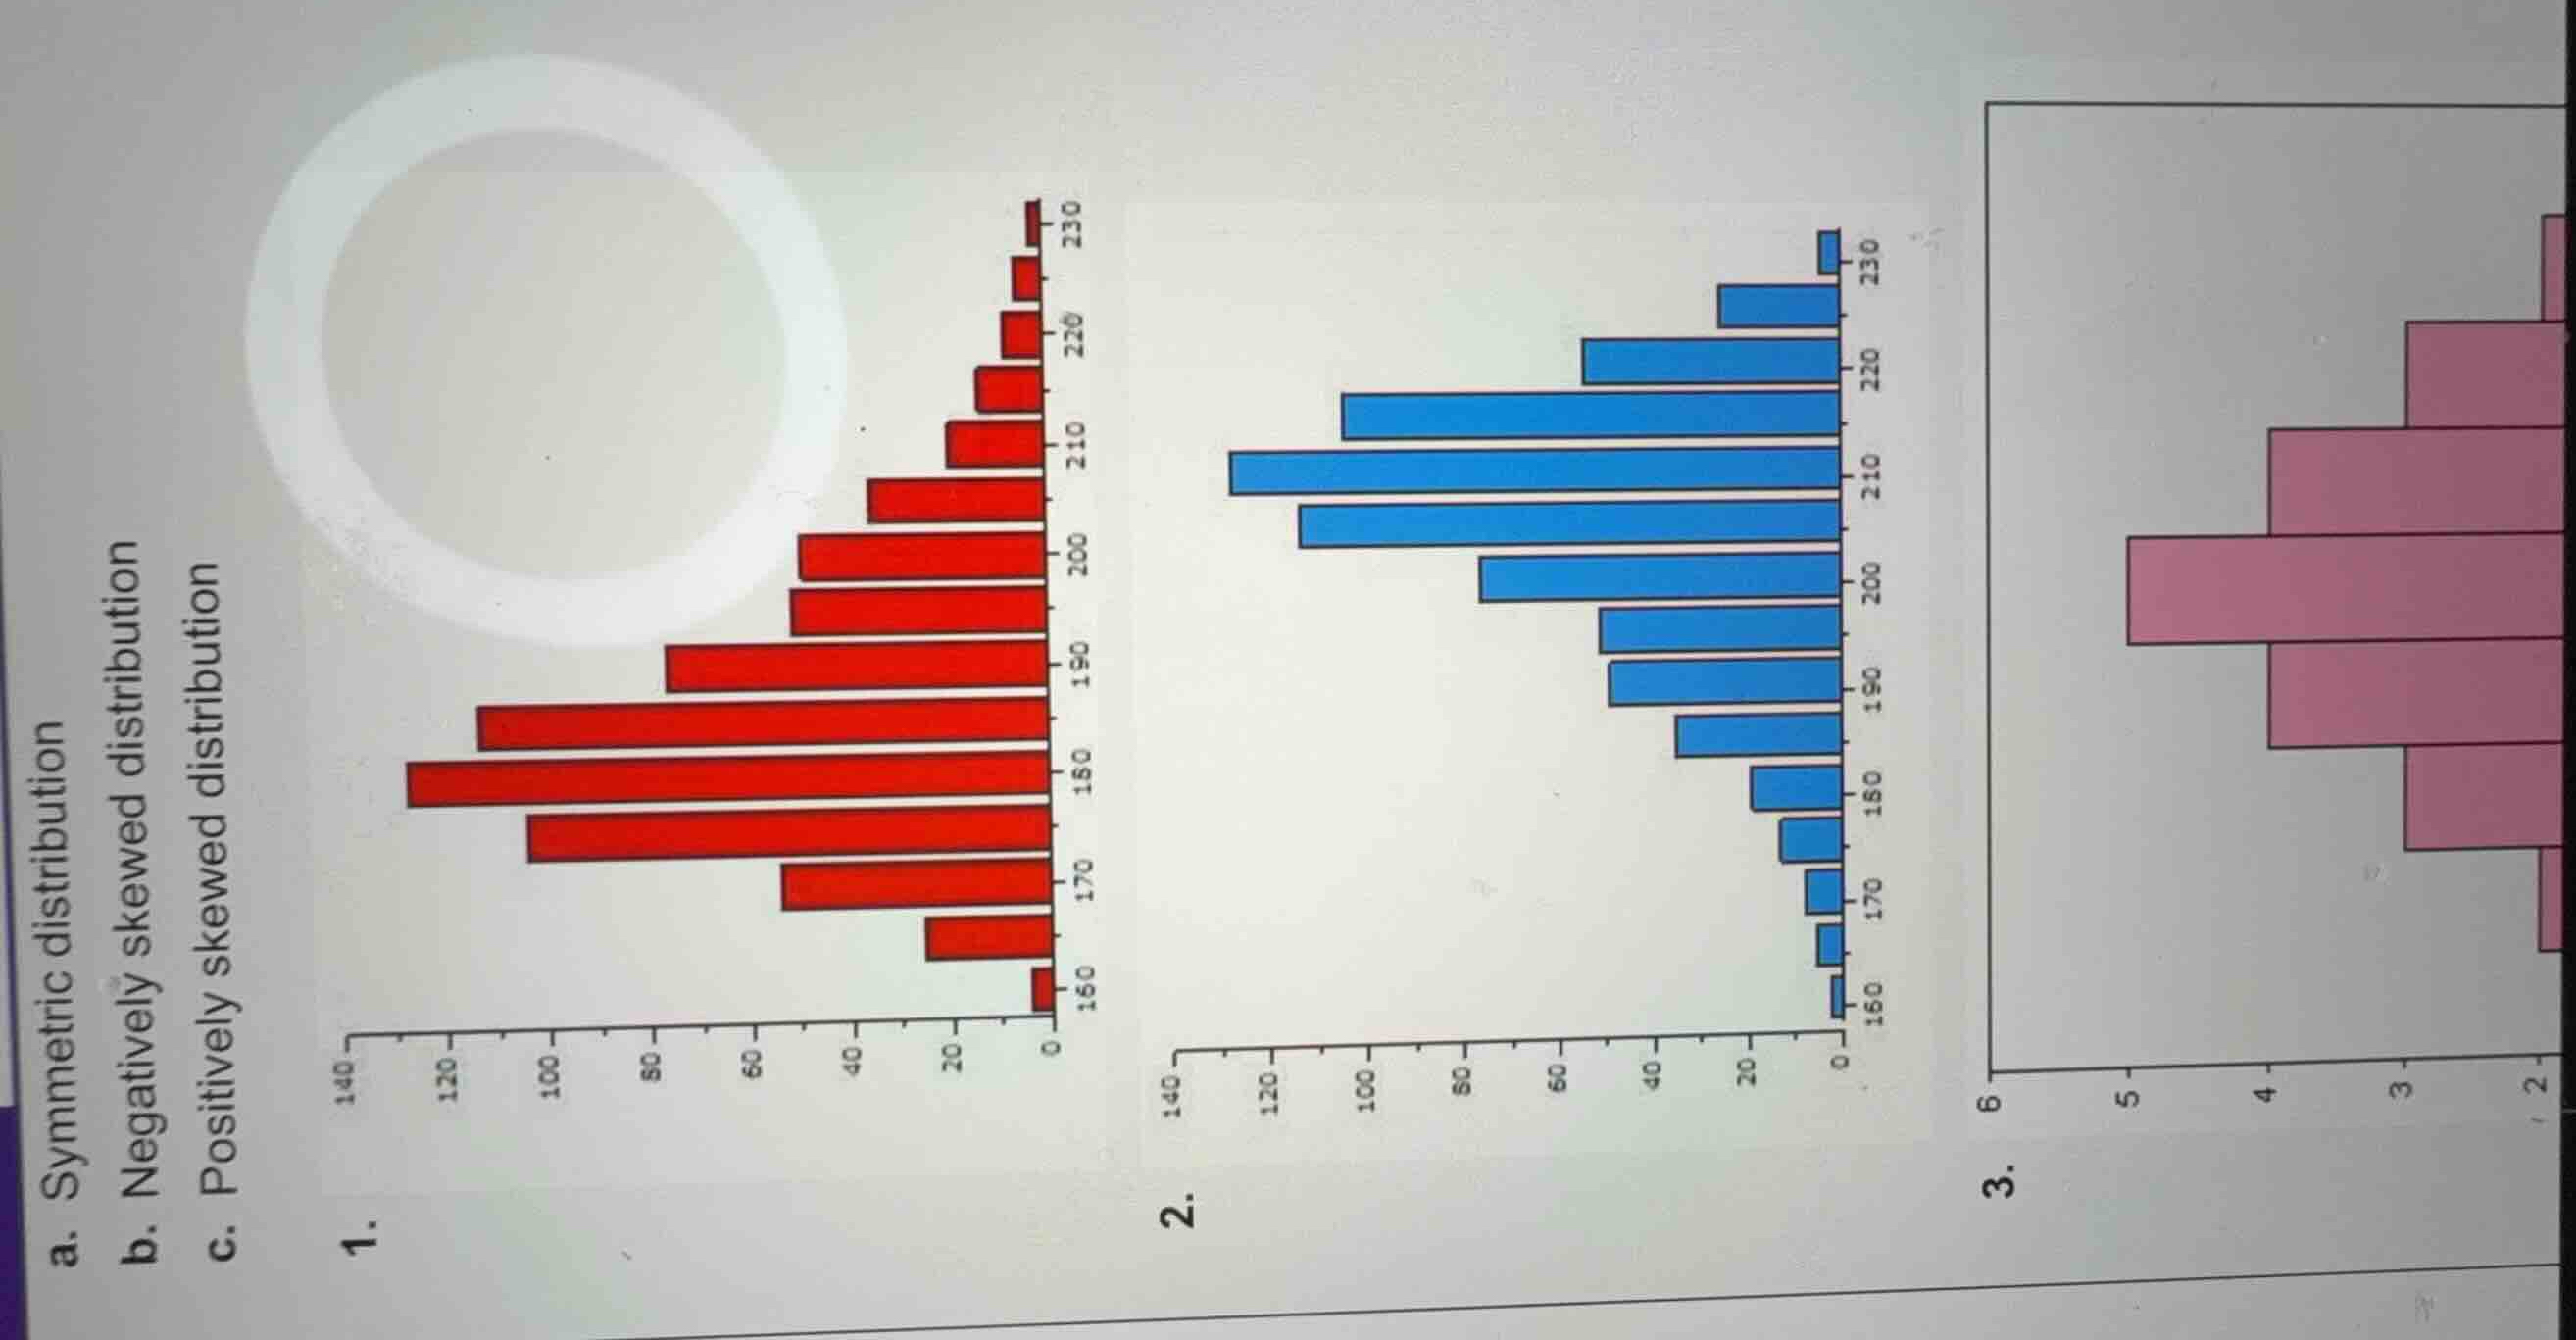
Analyze the orientation of the graphs
The provided image is rotated $90^\circ$ counterclockwise. To analyze the distributions correctly, we read the axes by rotating our view $90^\circ$ clockwise:
- The horizontal axis represents the frequency (ranging from $0$ to $140$ for graphs 1 and 2, and $2$ to $6$ for graph 3).
- The vertical axis represents the data values (ranging from $160$ to $230$ for graphs 1 and 2).
- Therefore, the bars extend horizontally to the left. To view these as standard histograms where bars go upward, we look at the data values (on the vertical axis) as the horizontal scale, where values increase from bottom ($160$) to top ($230$).
Classify Distribution 1
Using the Data Analysis knowledge point:
- In Graph 1, the peak of the distribution is located near the lower values (around $175$ to $180$).
- As the data values increase toward $230$ (moving upward along the vertical axis), the frequencies gradually taper off, creating a long tail extending toward the larger values.
- A distribution with a long tail extending toward the higher values (right side on a standard horizontal plot, or upper values here) is a positively skewed distribution.
Classify Distribution 2
Using the Data Analysis knowledge point:
- In Graph 2, the peak of the distribution is located near the higher values (around $210$ to $215$).
- As we look toward the lower values near $160$ (moving downward along the vertical axis), the frequencies taper off, creating a long tail extending toward the smaller values.
- A distribution with a long tail extending toward the lower values (left side on a standard horizontal plot, or lower values here) is a negatively skewed distribution.
Classify Distribution 3
Using the Data Analysis knowledge point:
- In Graph 3, the peak of the distribution is located in the middle (around value $4$).
- The frequencies decrease in a balanced, mirror-like fashion as we move both downward toward $2$ and upward toward $6$.
- Since both sides of the peak are approximately mirror images of each other, this is a symmetric distribution.

Snap & solve any problem in the app
Get step-by-step solutions on Sovi AI
Photo-based solutions with guided steps
Explore more problems and detailed explanations
Question 1
- a. Symmetric distribution
- b. Negatively skewed distribution
- c. Positively skewed distribution (Correct answer)
Question 2
- a. Symmetric distribution
- b. Negatively skewed distribution (Correct answer)
- c. Positively skewed distribution
Question 3
- a. Symmetric distribution (Correct answer)
- b. Negatively skewed distribution
- c. Positively skewed distribution