QUESTION IMAGE
Question
solve the problem.
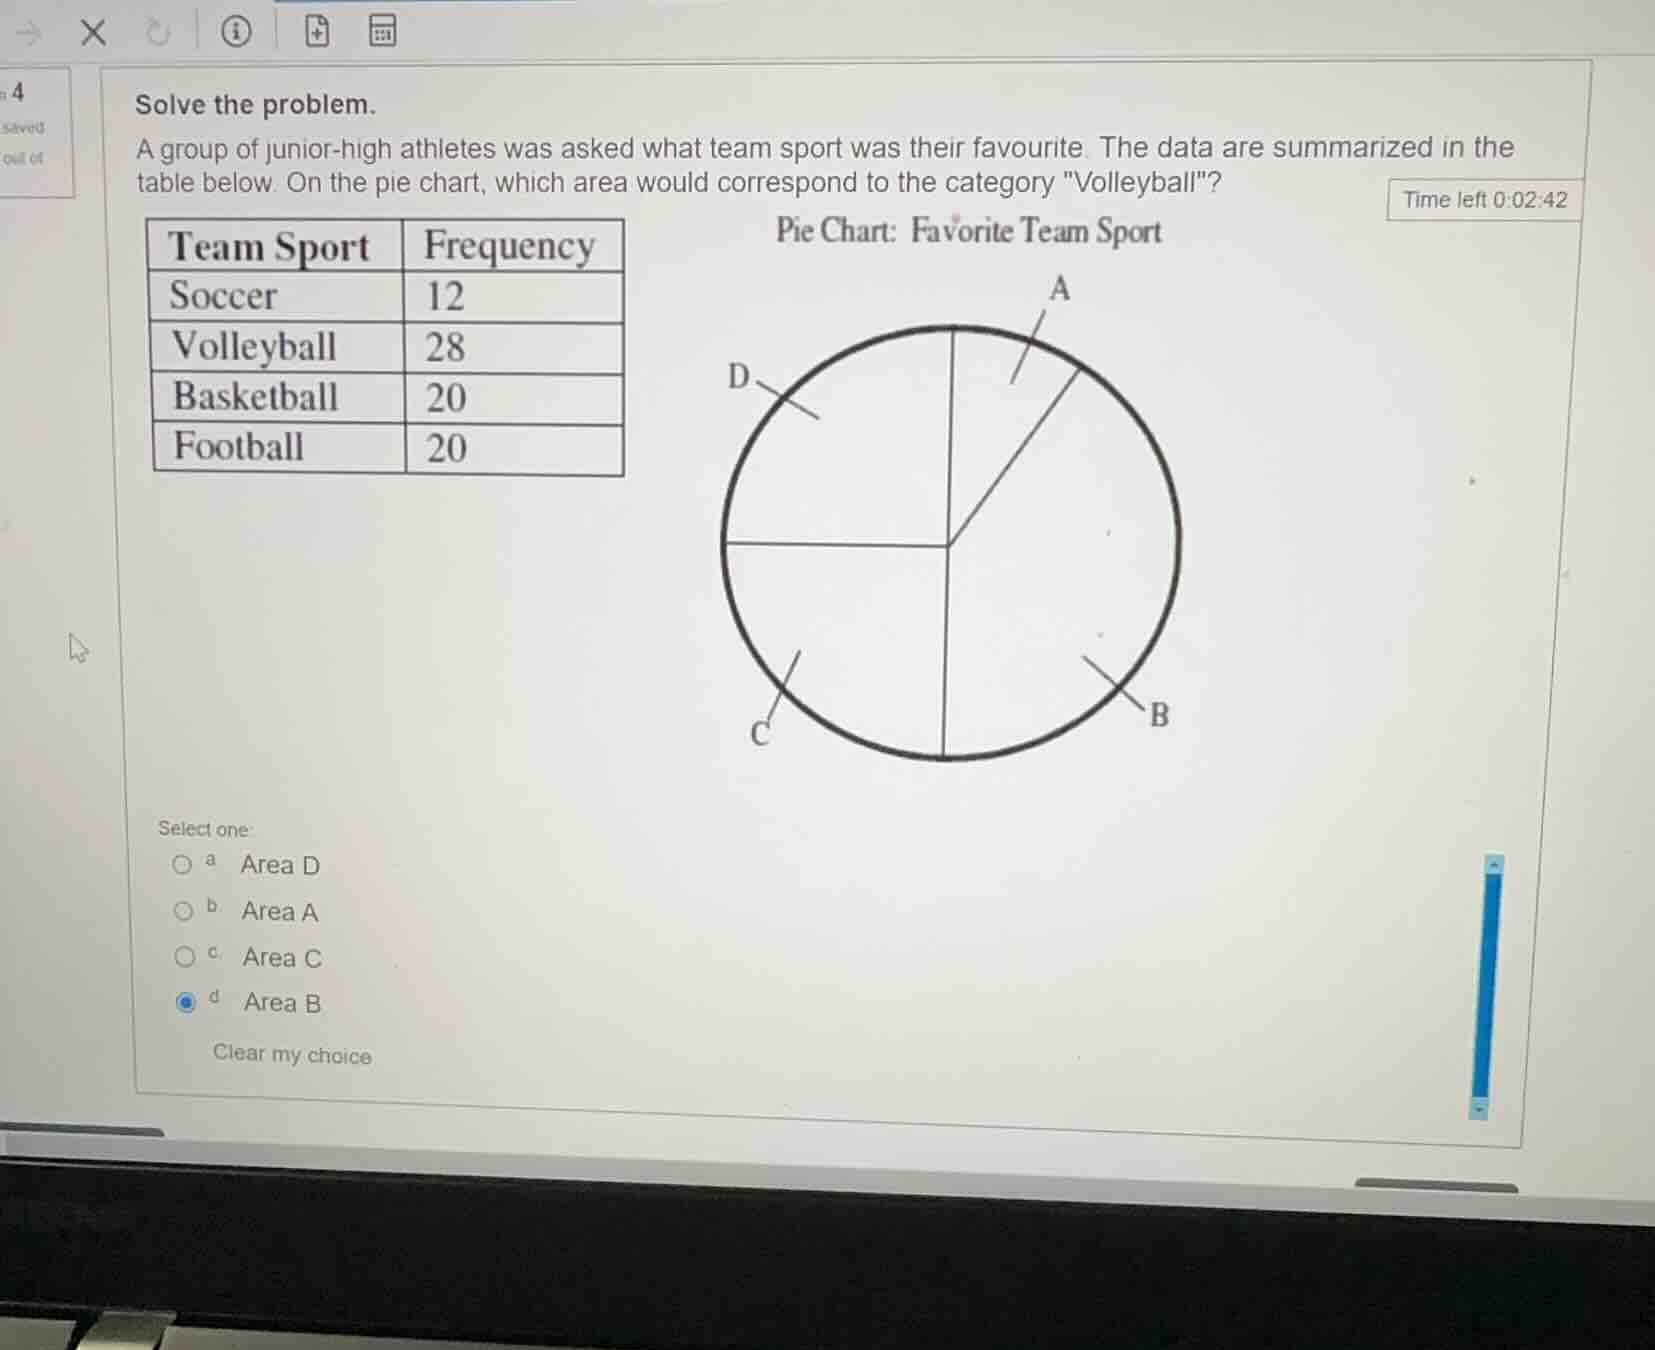
a group of junior-high athletes was asked what team sport was their favourite. the data are summarized in the table below. on the pie chart, which area would correspond to the category \volleyball\?
\
$$\begin{tabular}{|l|l|}
\\hline
team sport & frequency \\\\
\\hline
soccer & 12 \\\\
\\hline
volleyball & 28 \\\\
\\hline
basketball & 20 \\\\
\\hline
football & 20 \\\\
\\hline
\\end{tabular}$$
select one:
a. area d
b. area a
c. area c
d. area b
Calculate the total frequency
Find the sum of all frequencies.
$$
\text{Total} = 12 + 28 + 20 + 20 = 80
$$
Determine the proportions
Calculate the percentage for each sport.
$$
\text{Soccer} = \frac{12}{80} = 15\%
$$
$$
\text{Volleyball} = \frac{28}{80} = 35\%
$$
$$
\text{Basketball} = \frac{20}{80} = 25\%
$$
$$
\text{Football} = \frac{20}{80} = 25\%
$$
Analyze the pie chart sectors
Compare the calculated percentages to the visual sectors.
- Two sectors are exactly equal to \(25\%\) (quarter circles): Area C and Area D.
- One sector is smaller than \(25\%\): Area A.
- One sector is larger than \(25\%\): Area B.
Match Volleyball to its sector
Identify the sector representing \(35\%\).
- Volleyball has the largest frequency (\(35\%\)).
- Area B is the only sector larger than a quarter circle.
- Therefore, Volleyball corresponds to Area B.

Snap & solve any problem in the app
Get step-by-step solutions on Sovi AI
Photo-based solutions with guided steps
Explore more problems and detailed explanations
- a Area D
- b Area A
- c Area C
- d Area B (Correct answer)