QUESTION IMAGE
Question
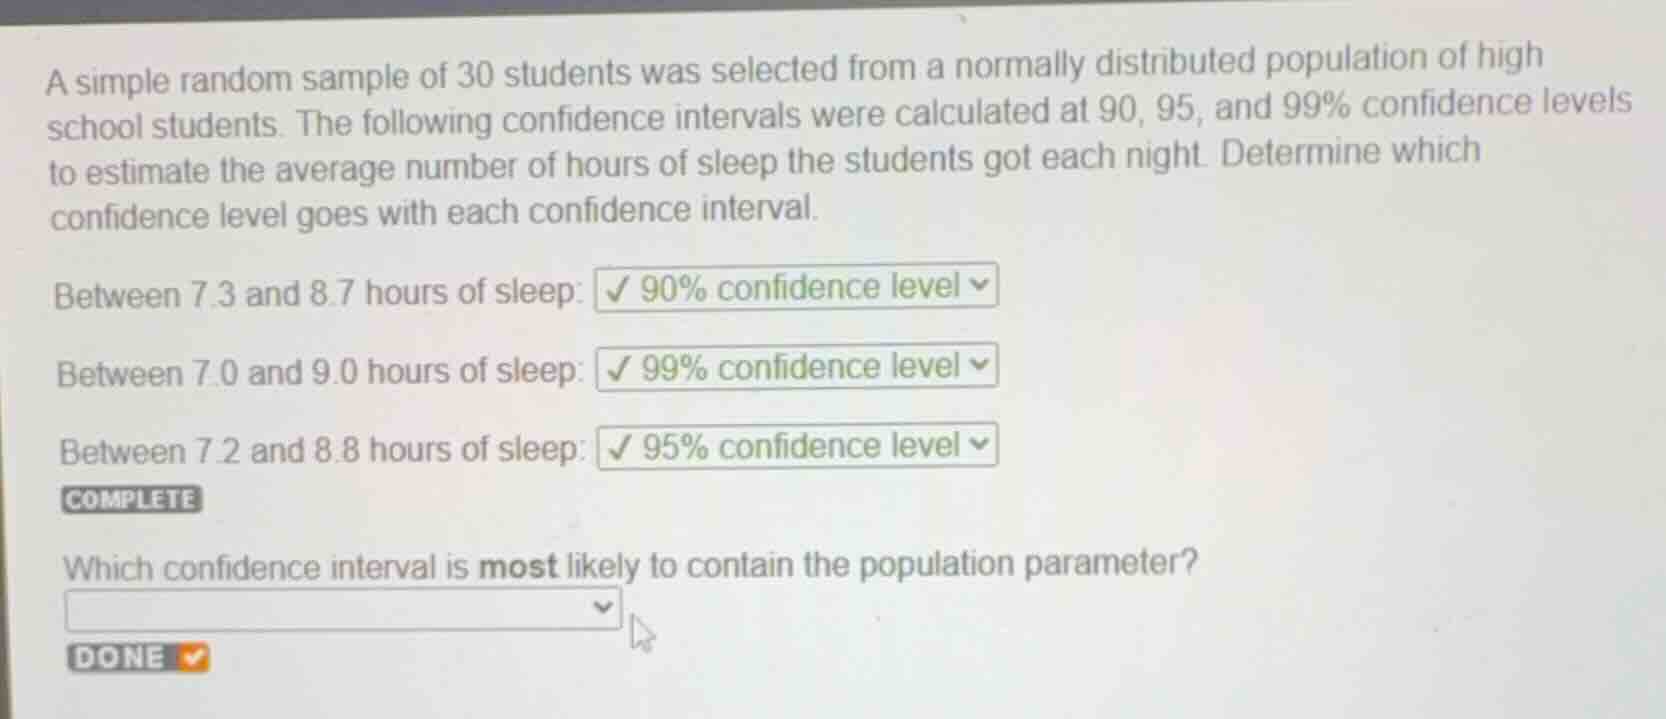
a simple random sample of 30 students was selected from a normally distributed population of high school students. the following confidence intervals were calculated at 90, 95, and 99% confidence levels to estimate the average number of hours of sleep the students got each night. determine which confidence level goes with each confidence interval.
between 7.3 and 8.7 hours of sleep: 90% confidence level
between 7.0 and 9.0 hours of sleep: 99% confidence level
between 7.2 and 8.8 hours of sleep: 95% confidence level
which confidence interval is most likely to contain the population parameter?
Analyze confidence levels and interval widths
Using the Confidence Interval Width and Confidence Level Relationship knowledge points
A confidence interval is calculated as:
The margin of error increases as the confidence level increases (because the critical value \(z^*\) or \(t^*\) increases). Therefore:
- A higher confidence level results in a wider confidence interval.
- A lower confidence level results in a narrower confidence interval.
Let's calculate the widths of the three given intervals:
- Between \(7.3\) and \(8.7\) hours:
This is the narrowest interval, corresponding to the lowest confidence level: \(90\%\).
- Between \(7.2\) and \(8.8\) hours:
This is the middle interval, corresponding to the middle confidence level: \(95\%\).
- Between \(7.0\) and \(9.0\) hours:
This is the widest interval, corresponding to the highest confidence level: \(99\%\).
Determine the interval most likely to contain the parameter
Using the Confidence Level Relationship knowledge point
The confidence level represents the long-run probability (or proportion) of intervals calculated from repeated samples that will contain the true population parameter.
- The interval with the \(99\%\) confidence level has a \(99\%\) probability of containing the true population mean.
- The interval with the \(95\%\) confidence level has a \(95\%\) probability.
- The interval with the \(90\%\) confidence level has a \(90\%\) probability.
Therefore, the interval corresponding to the highest confidence level (\(99\%\)), which is Between 7.0 and 9.0 hours of sleep, is the most likely to contain the population parameter.

Snap & solve any problem in the app
Get step-by-step solutions on Sovi AI
Photo-based solutions with guided steps
Explore more problems and detailed explanations
Which confidence interval is most likely to contain the population parameter?
<blank>Between 7.0 and 9.0 hours of sleep</blank>