QUESTION IMAGE
Question
select the correct answer.
figure a
figure b
figure c
figure d
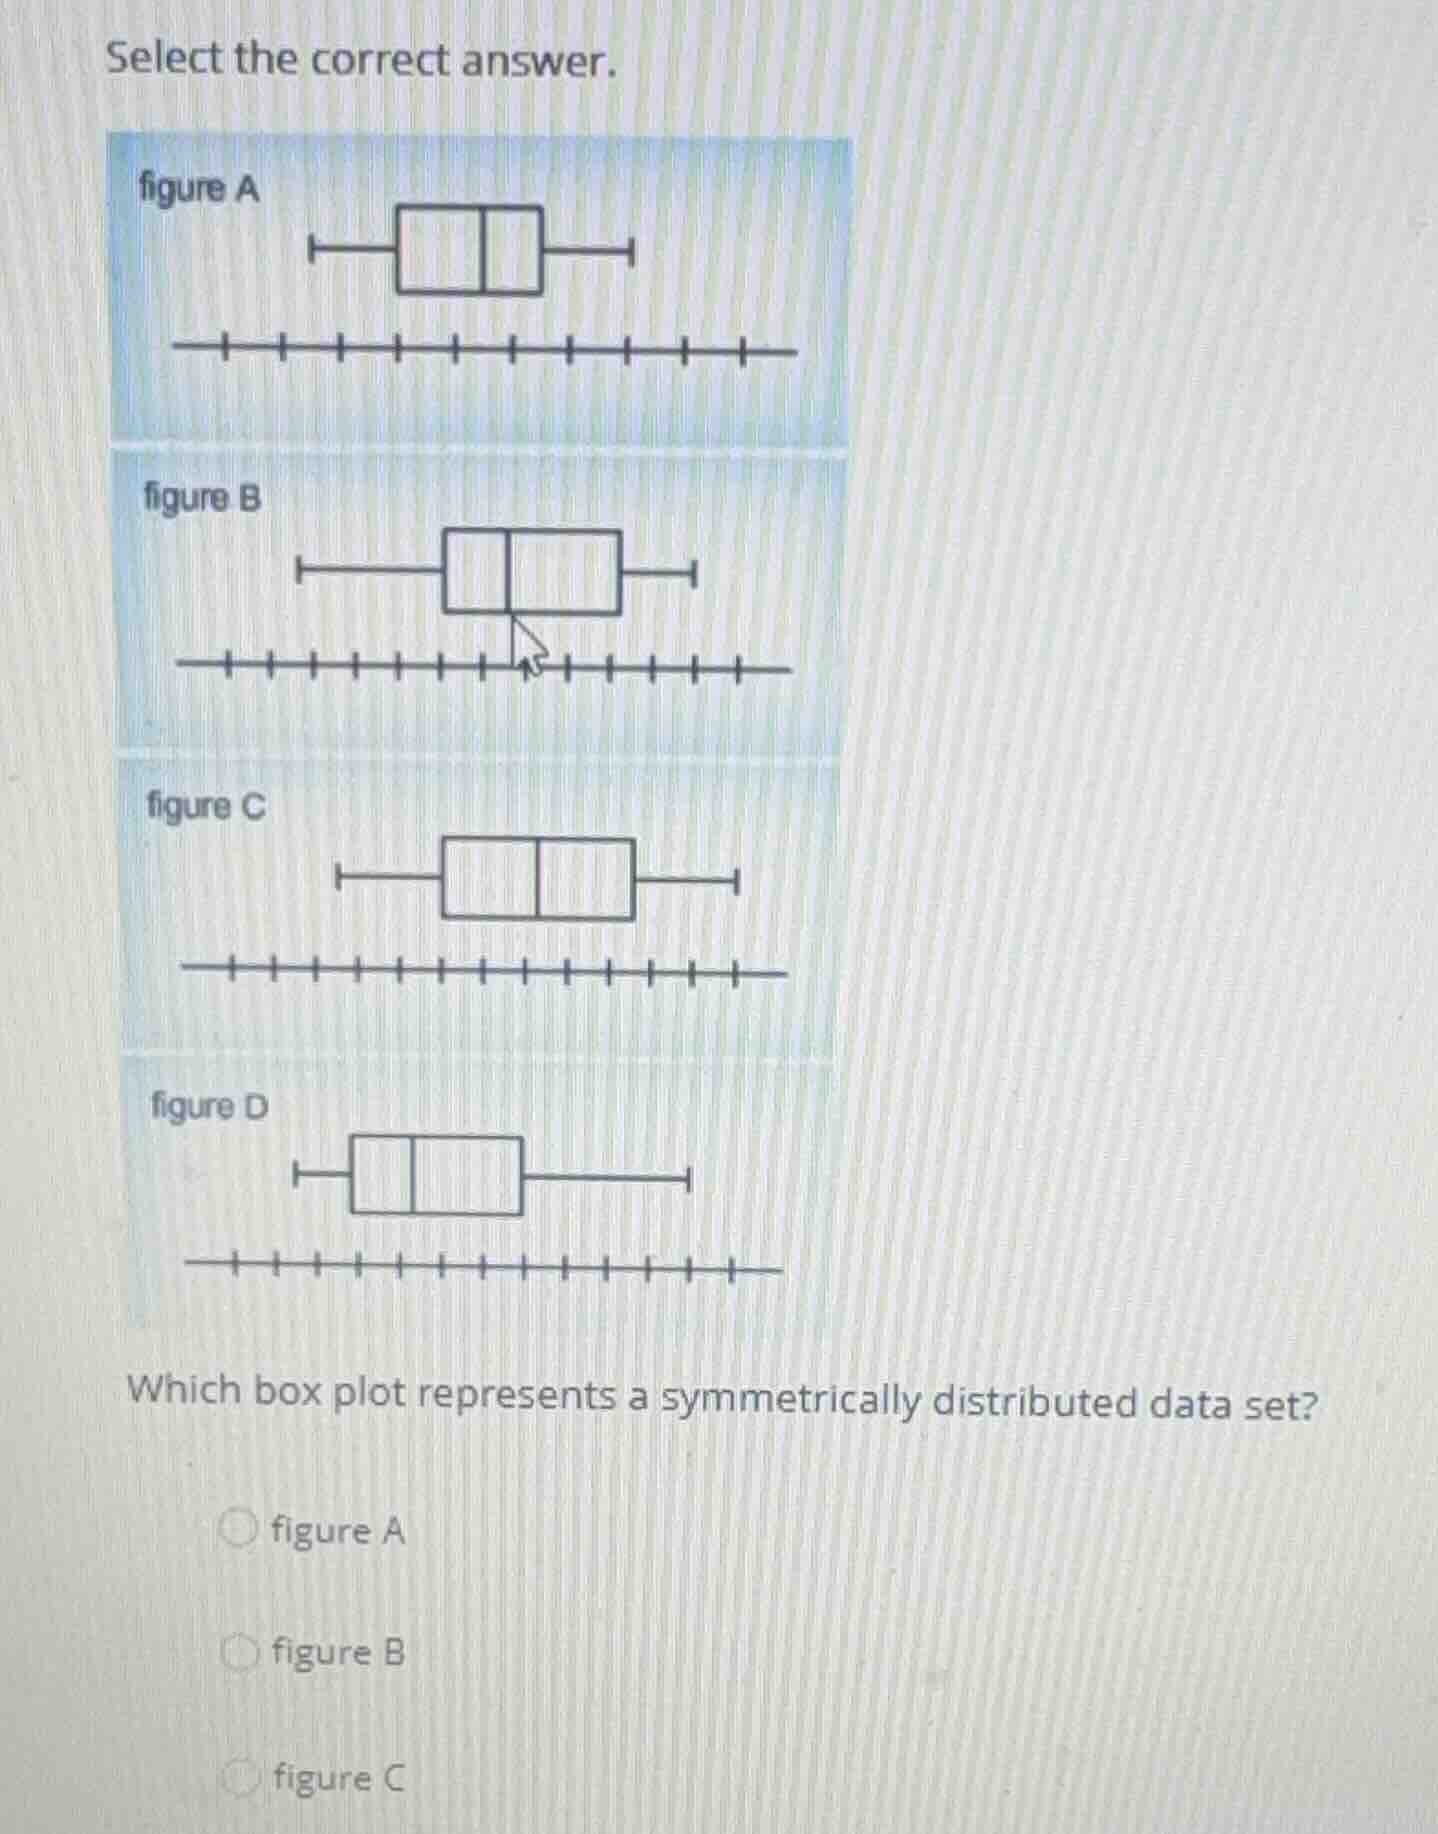
which box plot represents a symmetrically distributed data set?
figure a
figure b
figure c
Define symmetry in box plots
A box plot represents a symmetric distribution when the median line is in the exact center of the box, and the whiskers on both sides are of equal length.
Analyze each figure
- Figure A: The median line is centered in the box, and the left and right whiskers are of equal length (each spanning 2 units).
- Figure B: The median line is shifted to the left within the box, and the left whisker is longer than the right whisker.
- Figure C: The median line is centered in the box, but the right whisker is longer than the left whisker.
- Figure D: The median line is shifted to the left within the box, and the right whisker is much longer than the left whisker.
Select the symmetric representation
Figure A is perfectly balanced and symmetric.

Snap & solve any problem in the app
Get step-by-step solutions on Sovi AI
Photo-based solutions with guided steps
Explore more problems and detailed explanations
- figure A (Correct answer)
- figure B
- figure C