QUESTION IMAGE
Question
select all the correct answers.
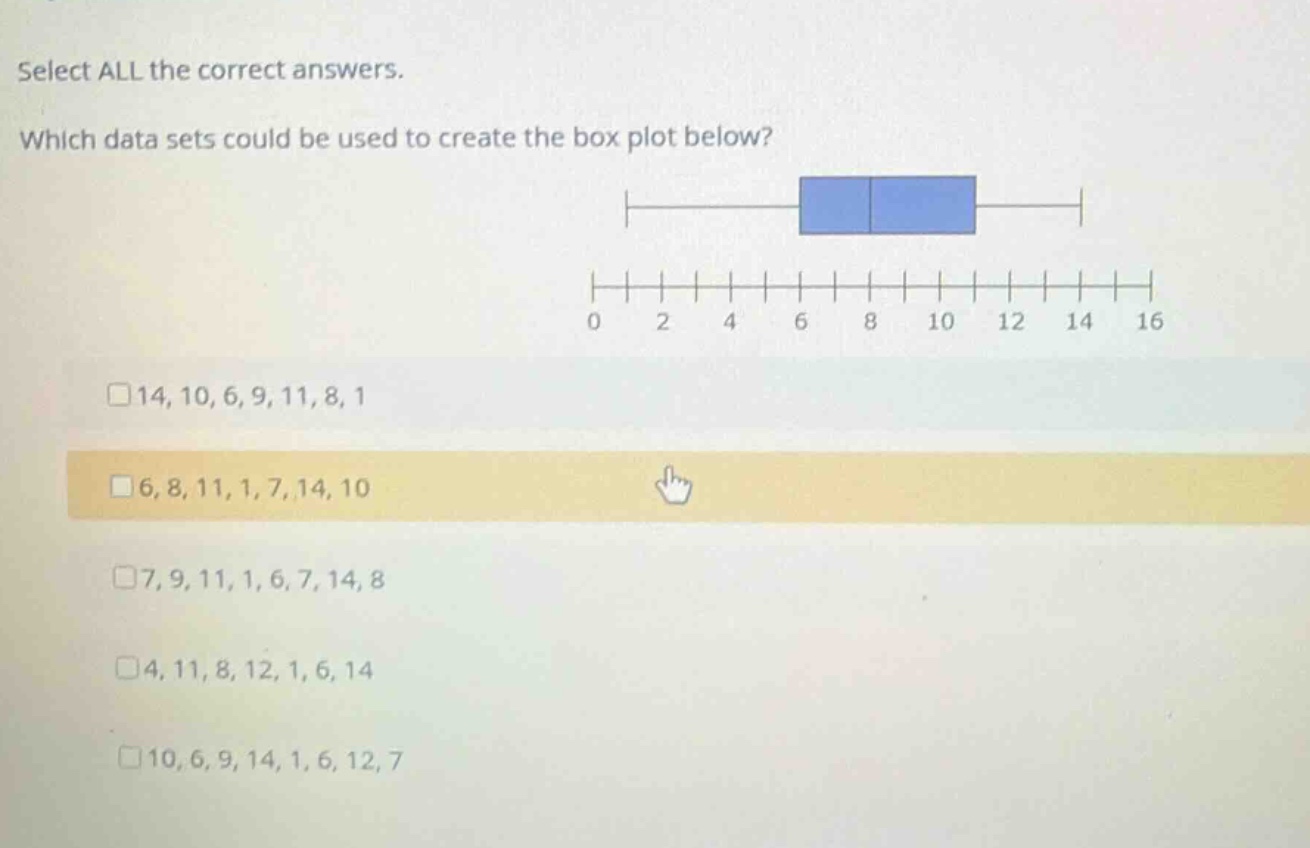
which data sets could be used to create the box plot below?
- 14, 10, 6, 9, 11, 8, 1
- 6, 8, 11, 1, 7, 14, 10
- 7, 9, 11, 1, 6, 7, 14, 8
- 4, 11, 8, 12, 1, 6, 14
- 10, 6, 9, 14, 1, 6, 12, 7
⚡ Using what you learned: displaying data: histograms & box plots
Step 1: Identify the five-number summary from the box plot
From the given box plot, we can read the five-number summary:
- Minimum (\(\text{Min}\)) = \(1\)
- Lower Quartile (\(Q_1\)) = \(6\)
- Median (\(Q_2\)) = \(8\)
- Upper Quartile (\(Q_3\)) = \(11\)
- Maximum (\(\text{Max}\)) = \(14\)
Step 2: Analyze Option 1
Data set: \(14, 10, 6, 9, 11, 8, 1\)
- Order the data: \(1, 6, 8, 9, 10, 11, 14\)
- Find the summary statistics:
- \(\text{Min} = 1\)
- \(\text{Max} = 14\)
- \(\text{Median} = 9\) (This does not match the box plot median of \(8\))
Option 1 is incorrect.
Step 3: Analyze Option 2
Data set: \(6, 8, 11, 1, 7, 14, 10\)
- Order the data: \(1, 6, 7, 8, 10, 11, 14\)
- Find the summary statistics:
- \(\text{Min} = 1\)
- \(\text{Max} = 14\)
- \(\text{Median} = 8\)
- Lower half: \(1, 6, 7\) \(
ightarrow Q_1 = 6\)
- Upper half: \(10, 11, 14\) \(
ightarrow Q_3 = 11\)
All values match the box plot. Option 2 is correct.
Step 4: Analyze Option 3
Data set: \(7, 9, 11, 1, 6, 7, 14, 8\)
- Order the data: \(1, 6, 7, 7, 8, 9, 11, 14\)
- Find the summary statistics:
- \(\text{Min} = 1\)
- \(\text{Max} = 14\)
- \(\text{Median} = \frac{7 + 8}{2} = 7.5\) (This does not match the box plot median of \(8\))
Option 3 is incorrect.
Step 5: Analyze Option 4
Data set: \(4, 11, 8, 12, 1, 6, 14\)
- Order the data: \(1, 4, 6, 8, 11, 12, 14\)
- Find the summary statistics:
- \(\text{Min} = 1\)
- \(\text{Max} = 14\)
- \(\text{Median} = 8\)
- Lower half: \(1, 4, 6\) \(
ightarrow Q_1 = 4\) (This does not match \(Q_1 = 6\))
Option 4 is incorrect.
Step 6: Analyze Option 5
Data set: \(10, 6, 9, 14, 1, 6, 12, 7\)
- Order the data: \(1, 6, 6, 7, 9, 10, 12, 14\)
- Find the summary statistics:
- \(\text{Min} = 1\)
- \(\text{Max} = 14\)
- \(\text{Median} = \frac{7 + 9}{2} = 8\)
- Lower half: \(1, 6, 6, 7\) \(
ightarrow Q_1 = \frac{6 + 6}{2} = 6\)
- Upper half: \(9, 10, 12, 14\) \(
ightarrow Q_3 = \frac{10 + 12}{2} = 11\)
All values match the box plot. Option 5 is correct.

Snap & solve any problem in the app
Get step-by-step solutions on Sovi AI
Photo-based solutions with guided steps
Explore more problems and detailed explanations
The correct data sets are:
- \(6, 8, 11, 1, 7, 14, 10\) (Second option)
- \(10, 6, 9, 14, 1, 6, 12, 7\) (Fifth option)