QUESTION IMAGE
Question
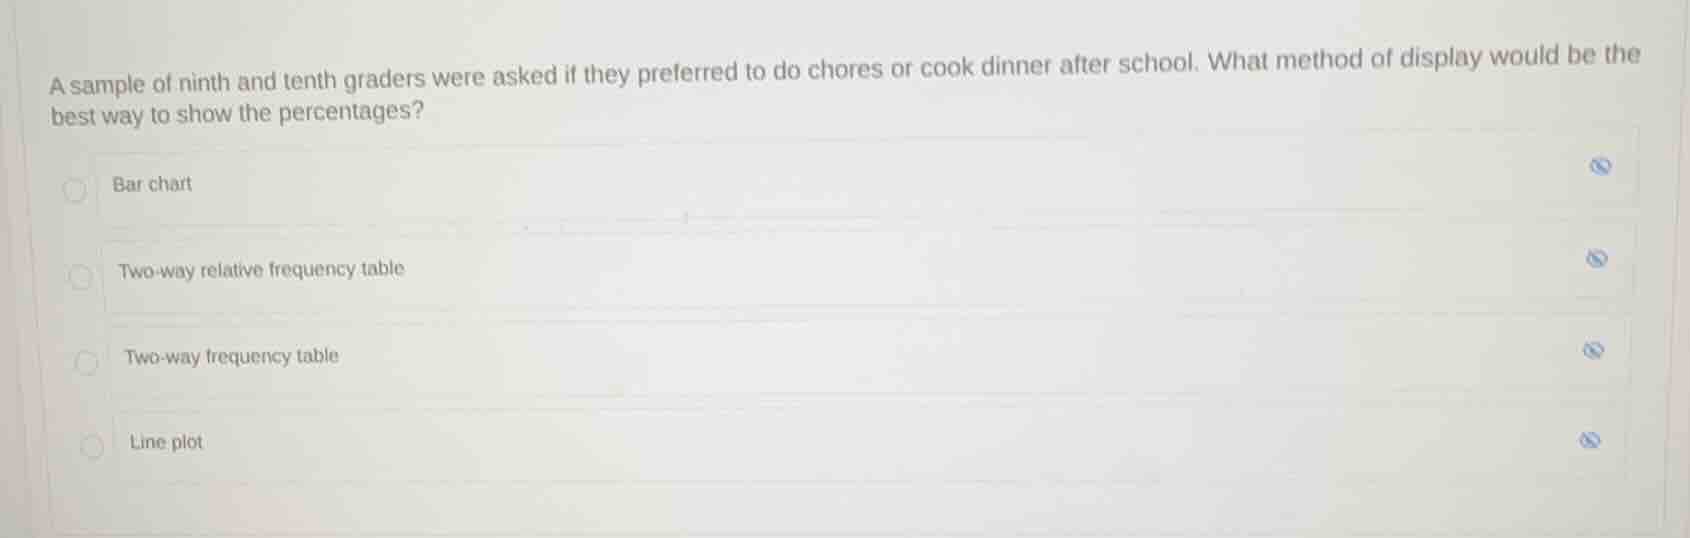
a sample of ninth and tenth graders were asked if they preferred to do chores or cook dinner after school. what method of display would be the best way to show the percentages?
bar chart
two-way relative frequency table
two-way frequency table
line plot
Identify variables and data types
The survey collects data on two categorical variables from a sample of students:
- Grade level (ninth graders vs. tenth graders)
- After-school preference (doing chores vs. cooking dinner)
Determine the appropriate display method
Using the Two-Way Tables knowledge point
- A two-way table is used to organize and analyze bivariate categorical data.
- A standard frequency table displays raw counts.
- A relative frequency table displays proportions or percentages.
- Since the question specifically asks for the best way to show the percentages, a relative frequency table is required.
Select the correct option
Combining these requirements, a two-way relative frequency table is the best method to display the percentages of preferences across the two grade levels.

Snap & solve any problem in the app
Get step-by-step solutions on Sovi AI
Photo-based solutions with guided steps
Explore more problems and detailed explanations
- Bar chart
- Two-way relative frequency table (Correct answer)
- Two-way frequency table
- Line plot