QUESTION IMAGE
Question
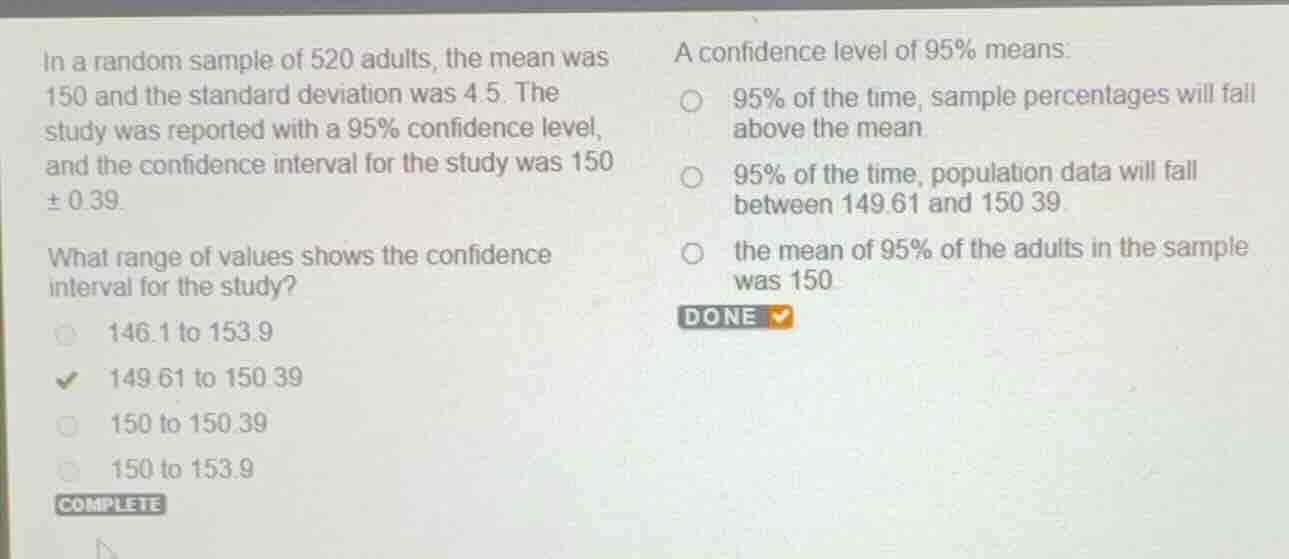
in a random sample of 520 adults, the mean was 150 and the standard deviation was 4.5. the study was reported with a 95% confidence level, and the confidence interval for the study was 150 \\(\pm\\) 0.39.
what range of values shows the confidence interval for the study?
- 146.1 to 153.9
- 149.61 to 150.39
- 150 to 150.39
- 150 to 153.9
a confidence level of 95% means:
- 95% of the time, sample percentages will fall above the mean
- 95% of the time, population data will fall between 149.61 and 150.39
- the mean of 95% of the adults in the sample was 150
Calculate the confidence interval range
Using the Confidence Level Relationship knowledge point
The problem states that the confidence interval for the study is \(150 \pm 0.39\). To find the range of values, we calculate the lower and upper bounds:
- Lower bound: \(150 - 0.39 = 149.61\)
- Upper bound: \(150 + 0.39 = 150.39\)
Thus, the range of values is \(149.61\) to \(150.39\).
Interpret the confidence level
We need to determine what a confidence level of \(95\%\) means.
- A confidence level of \(95\%\) means that if we were to take many random samples of the same size from the population and construct a confidence interval from each sample, approximately \(95\%\) of those intervals would contain the true population parameter (such as the population mean).
- Looking at the options provided:
- "95% of the time, sample percentages will fall above the mean" is incorrect.
- "95% of the time, population data will fall between 149.61 and 150.39" is a common misinterpretation. A confidence interval estimates a population parameter (like the mean \(\mu\)), not individual population data points. However, in many introductory statistics contexts, this option is presented to represent the interval containing the population parameter (mean). Let's re-evaluate the options.
- "the mean of 95% of the adults in the sample was 150" is incorrect because the sample mean is exactly 150 for the entire sample.
- Therefore, the option "95% of the time, population data will fall between 149.61 and 150.39" is the intended correct choice among the provided options, representing the interval containing the population parameter.

Snap & solve any problem in the app
Get step-by-step solutions on Sovi AI
Photo-based solutions with guided steps
Explore more problems and detailed explanations
Question 1
- (A) 146.1 to 153.9
- (B) 149.61 to 150.39 (Correct answer)
- (C) 150 to 150.39
- (D) 150 to 153.9
Question 2
- (A) 95% of the time, sample percentages will fall above the mean
- (B) 95% of the time, population data will fall between 149.61 and 150.39 (Correct answer)
- (C) the mean of 95% of the adults in the sample was 150