QUESTION IMAGE
Question
question 4 (1 point) saved
solve the problem.
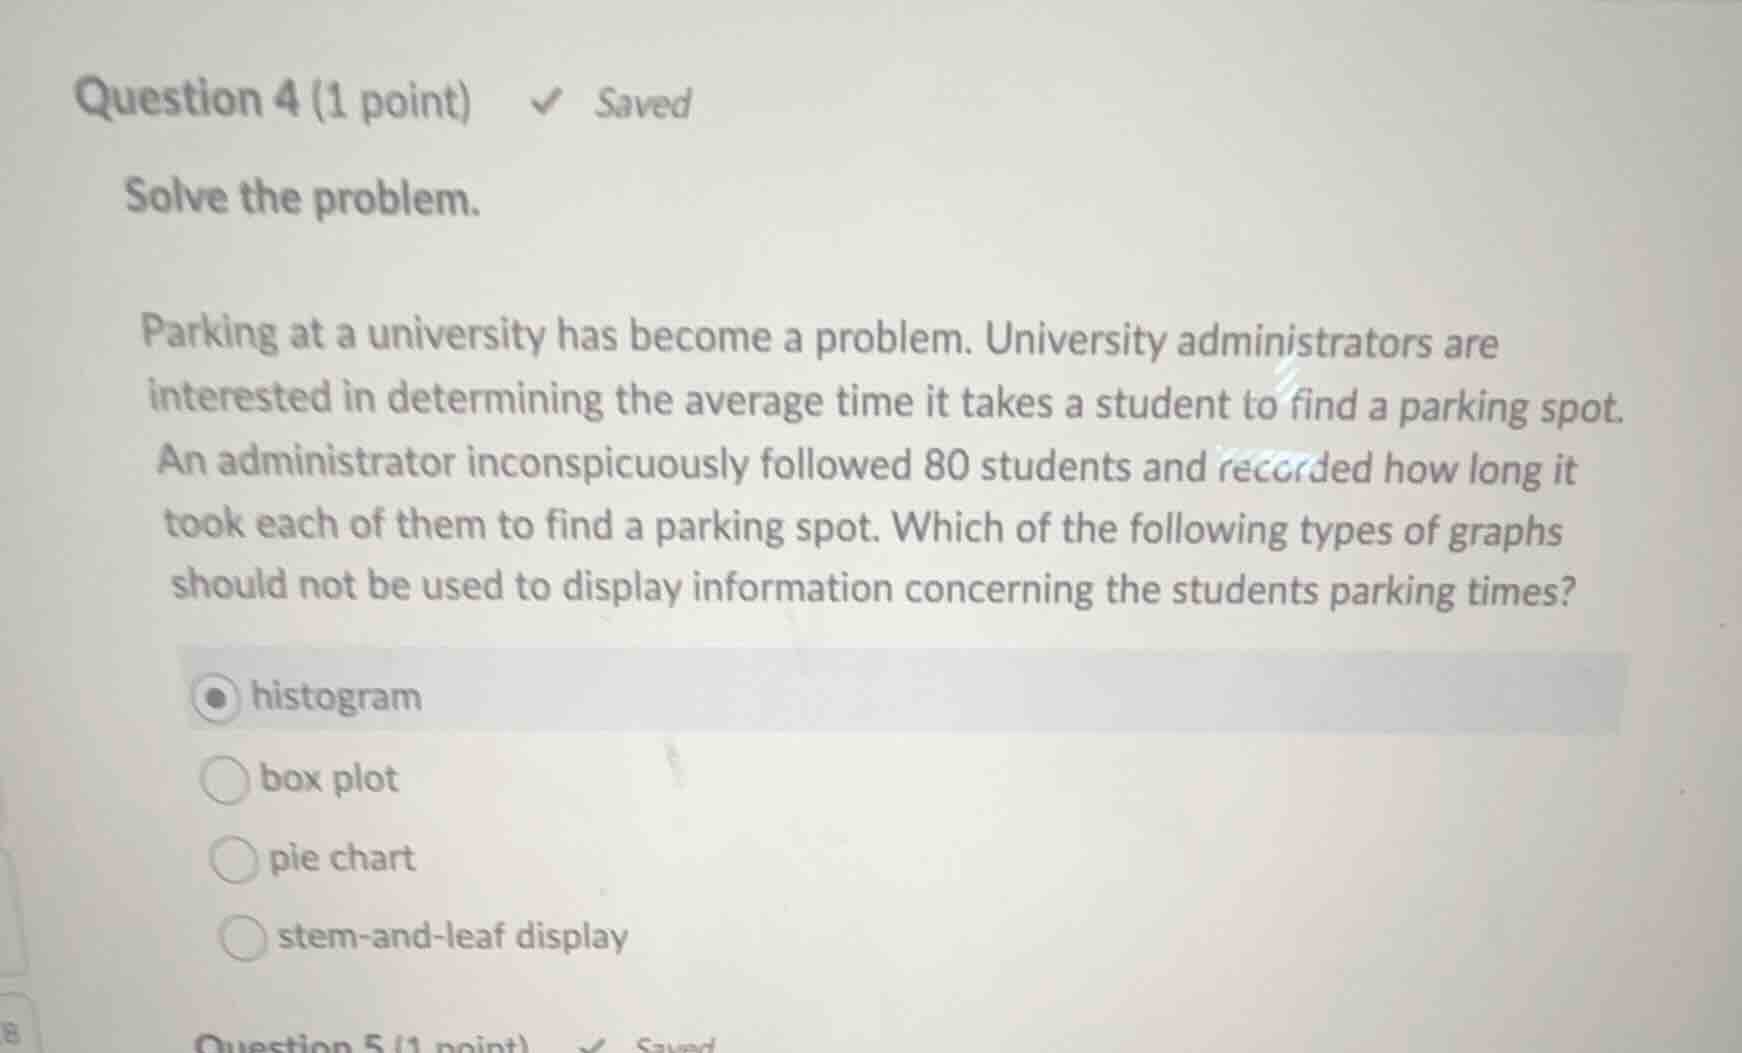
parking at a university has become a problem. university administrators are interested in determining the average time it takes a student to find a parking spot. an administrator inconspicuously followed 80 students and recorded how long it took each of them to find a parking spot. which of the following types of graphs should not be used to display information concerning the students parking times?
histogram
box plot
pie chart
stem-and-leaf display
Identify the variable type
Using the Descriptive Statistics knowledge point
The variable being measured is "how long it took each of them to find a parking spot," which is time. Time is a continuous quantitative (numerical) variable.
Evaluate appropriate graphs for quantitative data
Using the Descriptive Statistics knowledge point
Quantitative data can be displayed using histograms, box plots, and stem-and-leaf displays. These charts show the distribution, spread, and shape of numerical datasets.
Evaluate inappropriate graphs for quantitative data
Using the Descriptive Statistics knowledge point
Pie charts are designed to display categorical (qualitative) data, showing the relative proportions of different categories. They are not suitable for displaying continuous numerical data like individual parking times.

Snap & solve any problem in the app
Get step-by-step solutions on Sovi AI
Photo-based solutions with guided steps
Explore more problems and detailed explanations
- histogram
- box plot
- pie chart (Correct answer)
- stem-and-leaf display