QUESTION IMAGE
Question
question
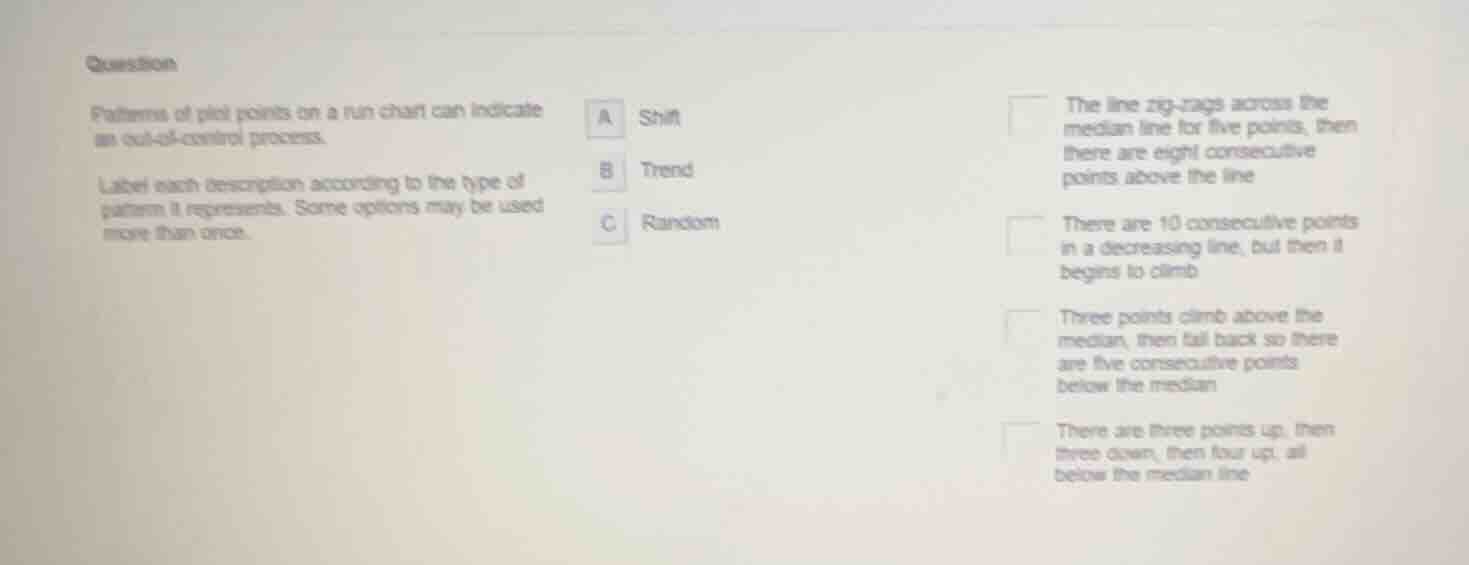
patterns of plot points on a run chart can indicate an out-of-control process.
label each description according to the type of pattern it represents. some options may be used more than once.
a shift
b trend
c random
the line zig-zags across the median line for five points, then there are eight consecutive points above the line
there are 10 consecutive points in a decreasing line, but then it begins to climb
three points climb above the median, then fall back so there are five consecutive points below the median
there are three points up, then three down, then four up, all below the median line
Analyze run chart patterns
In Process Improvement, run charts are used to monitor process performance over time. We need to classify each scenario into one of three patterns:
- Shift (A): A shift is indicated by a run of consecutive points (typically 6 or more, or 8 consecutive points depending on the specific rule) on one side of the median line.
- Trend (B): A trend is indicated by a consecutive drift of points in one direction (typically 5 or 6 consecutive points steadily increasing or decreasing).
- Random (C): Normal variation where points fluctuate above and below the median without forming a specific non-random pattern like a shift or a trend.
Evaluate the first description
- Description: "The line zig-zags across the median line for five points, then there are eight consecutive points above the line"
- Analysis: Having eight consecutive points on one side of the median line is a classic indication of a non-random Shift.
- Classification: A (Shift)
Evaluate the second description
- Description: "There are 10 consecutive points in a decreasing line, but then it begins to climb"
- Analysis: A series of 10 consecutive points moving in a single direction (decreasing) represents a clear Trend.
- Classification: B (Trend)
Evaluate the third description
- Description: "Three points climb above the median, then fall back so there are five consecutive points below the median"
- Analysis: This describes normal, short-term fluctuations around the median (no run of 6+ points on one side, and no long continuous trend). This represents normal variation.
- Classification: C (Random)
Evaluate the fourth description
- Description: "There are three points up, then three down, then four up, all below the median line"
- Analysis: Although the points fluctuate up and down, they are all on one side of the median line (all below). However, looking at the overall pattern, it describes short up-and-down movements without a sustained run of 6+ consecutive points on one side or a continuous trend. This represents normal, non-systematic variation.
- Classification: C (Random)

Snap & solve any problem in the app
Get step-by-step solutions on Sovi AI
Photo-based solutions with guided steps
Explore more problems and detailed explanations
Question 1
- (A) Description 1: Shift | Description 2: Trend | Description 3: Random | Description 4: Shift
- (B) Description 1: Shift | Description 2: Trend | Description 3: Random | Description 4: Random (Correct answer)
- (C) Description 1: Shift | Description 2: Shift | Description 3: Random | Description 4: Random
- (D) Description 1: Trend | Description 2: Trend | Description 3: Shift | Description 4: Random