QUESTION IMAGE
Question
question
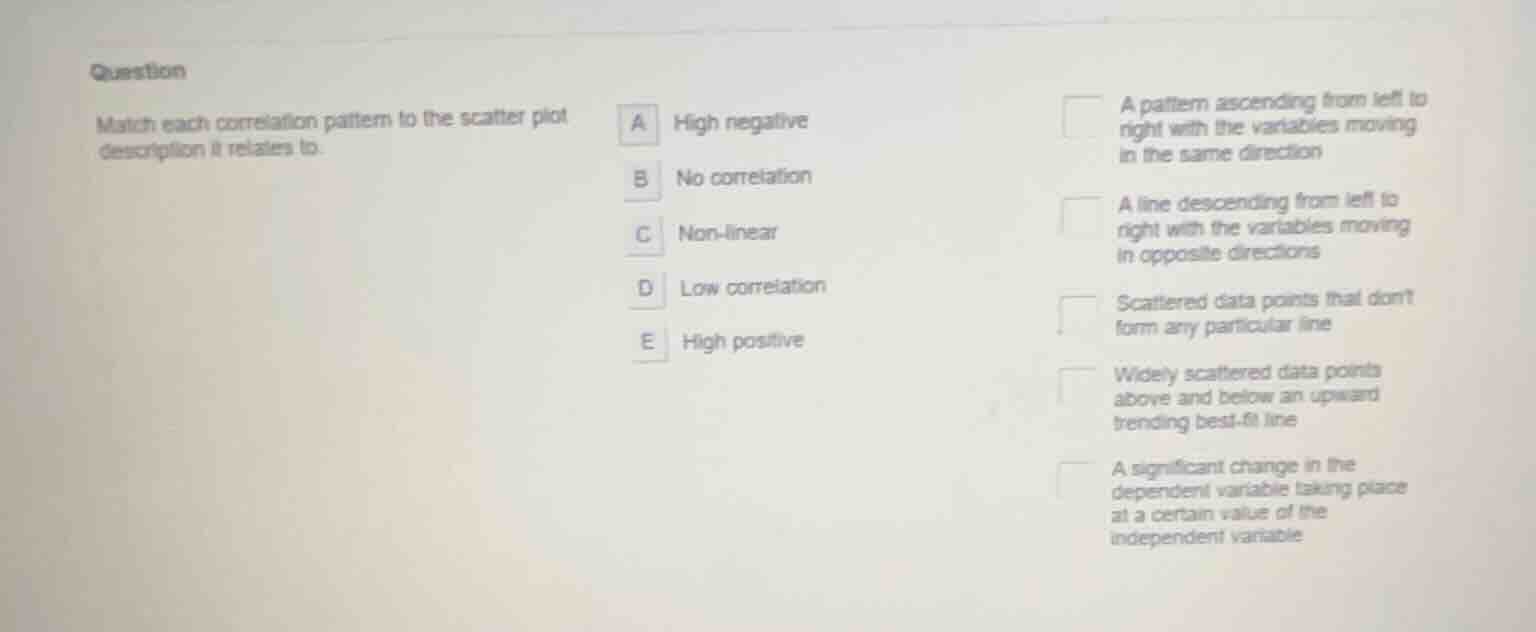
match each correlation pattern to the scatter plot description it relates to.
a high negative
b no correlation
c non-linear
d low correlation
e high positive
a pattern ascending from left to right with the variables moving in the same direction
a line descending from left to right with the variables moving in opposite directions
scattered data points that dont form any particular line
widely scattered data points above and below an upward trending best-fit line
a significant change in the dependent variable taking place at a certain value of the independent variable
Analyze positive correlation
A positive correlation means variables move together. An ascending pattern from left to right represents this. "High positive" matches a clear upward trend.
Analyze negative correlation
A negative correlation means variables move in opposite directions. A descending line from left to right represents this. "High negative" matches a clear downward trend.
Analyze no correlation
No correlation means data points are completely scattered. They do not form any line or trend.
Analyze low correlation
Low correlation means points are widely scattered but still show a weak trend. An upward trending best-fit line with widely scattered points represents this.
Analyze non-linear correlation
A non-linear relationship means the trend changes direction. A significant change in the dependent variable at a certain value of the independent variable represents this.

Snap & solve any problem in the app
Get step-by-step solutions on Sovi AI
Photo-based solutions with guided steps
Explore more problems and detailed explanations
- E (High positive) $
ightarrow$ A pattern ascending from left to right with the variables moving in the same direction
- A (High negative) $
ightarrow$ A line descending from left to right with the variables moving in opposite directions
- B (No correlation) $
ightarrow$ Scattered data points that don't form any particular line
- D (Low correlation) $
ightarrow$ Widely scattered data points above and below an upward trending best-fit line
- C (Non-linear) $
ightarrow$ A significant change in the dependent variable taking place at a certain value of the independent variable