QUESTION IMAGE
Question
question 33 points 2
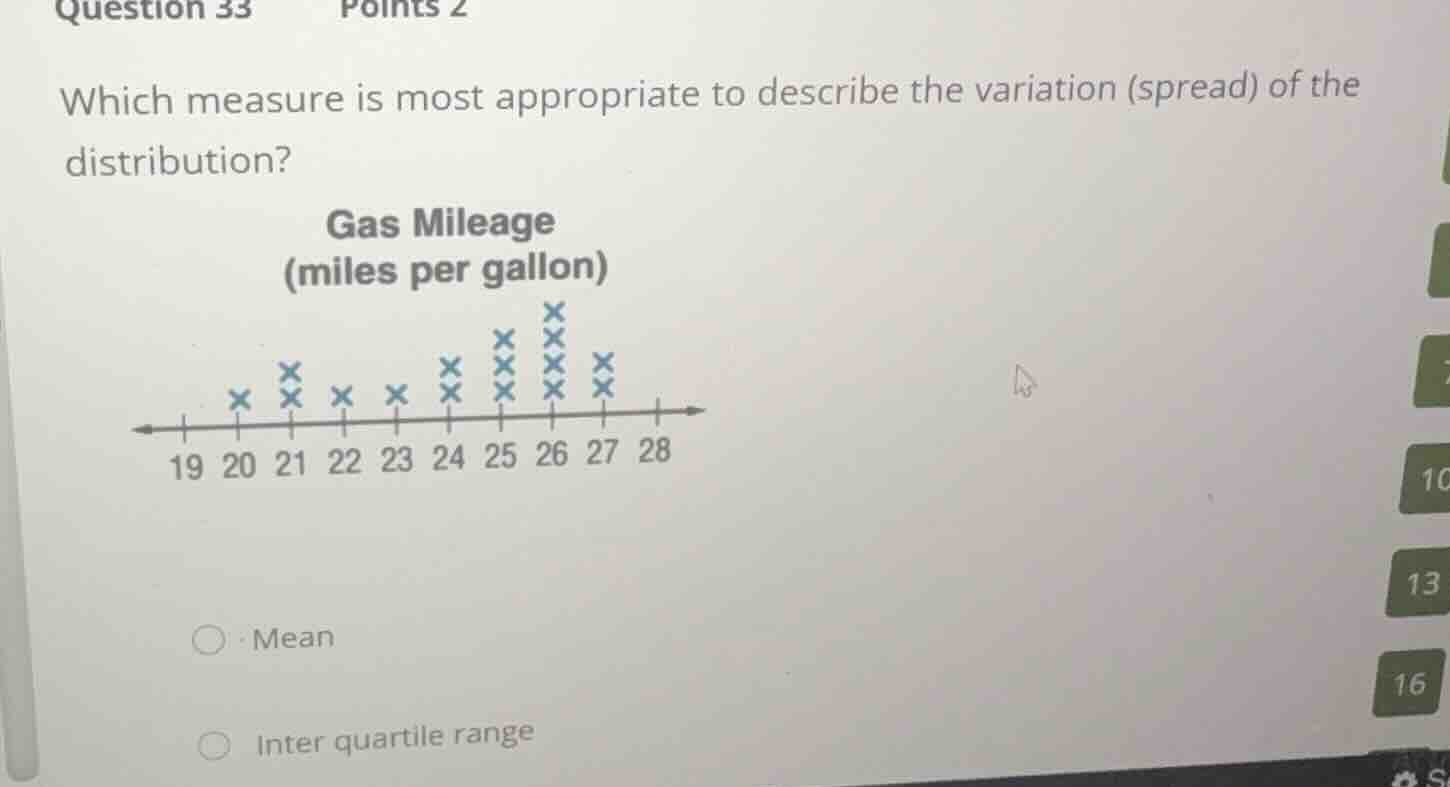
which measure is most appropriate to describe the variation (spread) of the distribution?
gas mileage
(miles per gallon)
mean
inter quartile range
Analyze the dot plot shape
Using the Dot Plot Interpretation and Skewness Direction knowledge points
The dot plot displays gas mileage data. The values range from 20 to 27. Looking at the distribution of the dots:
- Left tail: 20 (one dot), 21 (two dots), 22 (one dot), 23 (one dot)
- Right side peak: 25 (three dots), 26 (four dots), 27 (two dots)
The data is skewed to the left (negatively skewed) because there is a longer tail of lower values extending to the left, while the majority of the data points are clustered on the right.
Identify the target measure
Using the Measures of Spread knowledge point
The question asks for the most appropriate measure to describe the variation (spread) of this distribution.
- Measures of center: Mean, Median
- Measures of spread (variation): Standard deviation, Interquartile range (IQR), Range
Since the question specifically asks for a measure of variation (spread), we must choose between measures of spread, eliminating "Mean" (which is a measure of center).
Choose the robust measure of spread
Using the Interquartile Range knowledge point
For skewed distributions, extreme values or skewness heavily pull the mean and standard deviation. Therefore:
- For symmetric distributions, mean (center) and standard deviation (spread) are preferred.
- For skewed distributions, median (center) and interquartile range (spread) are preferred because they are resistant to skewness and outliers.
Since this distribution is left-skewed, the interquartile range is the most appropriate measure of variation.

Snap & solve any problem in the app
Get step-by-step solutions on Sovi AI
Photo-based solutions with guided steps
Explore more problems and detailed explanations
- Mean
- Inter quartile range (Correct answer)