QUESTION IMAGE
Question
question 11 (multiple choice worth 10 points)
(01.05h lc)
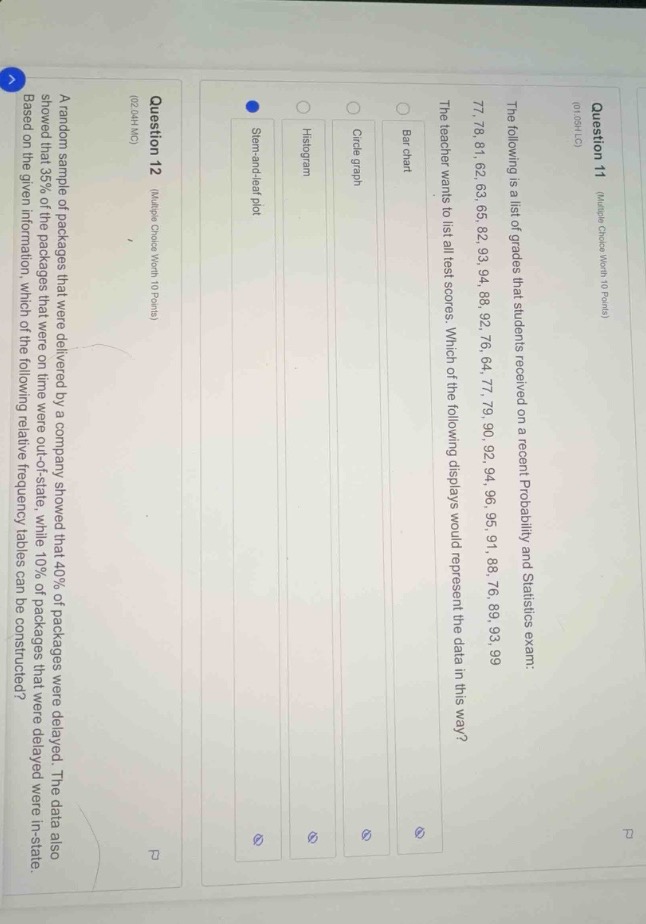
the following is a list of grades that students received on a recent probability and statistics exam:
77, 78, 81, 62, 63, 65, 82, 93, 94, 88, 92, 76, 64, 77, 79, 90, 92, 94, 96, 95, 91, 88, 76, 89, 93, 99
the teacher wants to list all test scores. which of the following displays would represent the data in this way?
- bar chart
- circle graph
- histogram
- stem-and-leaf plot
question 12 (multiple choice worth 10 points)
(02.04h mc)
a random sample of packages that were delivered by a company showed that 40% of packages were delayed. the data also showed that 35% of the packages that were on time were out-of-state, while 10% of packages that were delayed were in-state. based on the given information, which of the following relative frequency tables can be constructed?
Identify the goal of the data display
The teacher wants to display a list of individual numerical test scores in a way that lists all individual test scores.
Analyze the characteristics of each display method
- Bar chart: Used primarily for categorical data.
- Circle graph: Displays parts of a whole (percentages) for categorical data.
- Histogram: Groups numerical data into intervals (bins), which hides individual data values.
- Stem-and-leaf plot: Displays numerical data while preserving and showing every individual data value in the list.
Determine the correct option
A stem-and-leaf plot is the only display among the choices that lists every individual score.

Snap & solve any problem in the app
Get step-by-step solutions on Sovi AI
Photo-based solutions with guided steps
Explore more problems and detailed explanations
- Bar chart
- Circle graph
- Histogram
- Stem-and-leaf plot (Correct answer)