QUESTION IMAGE
Question
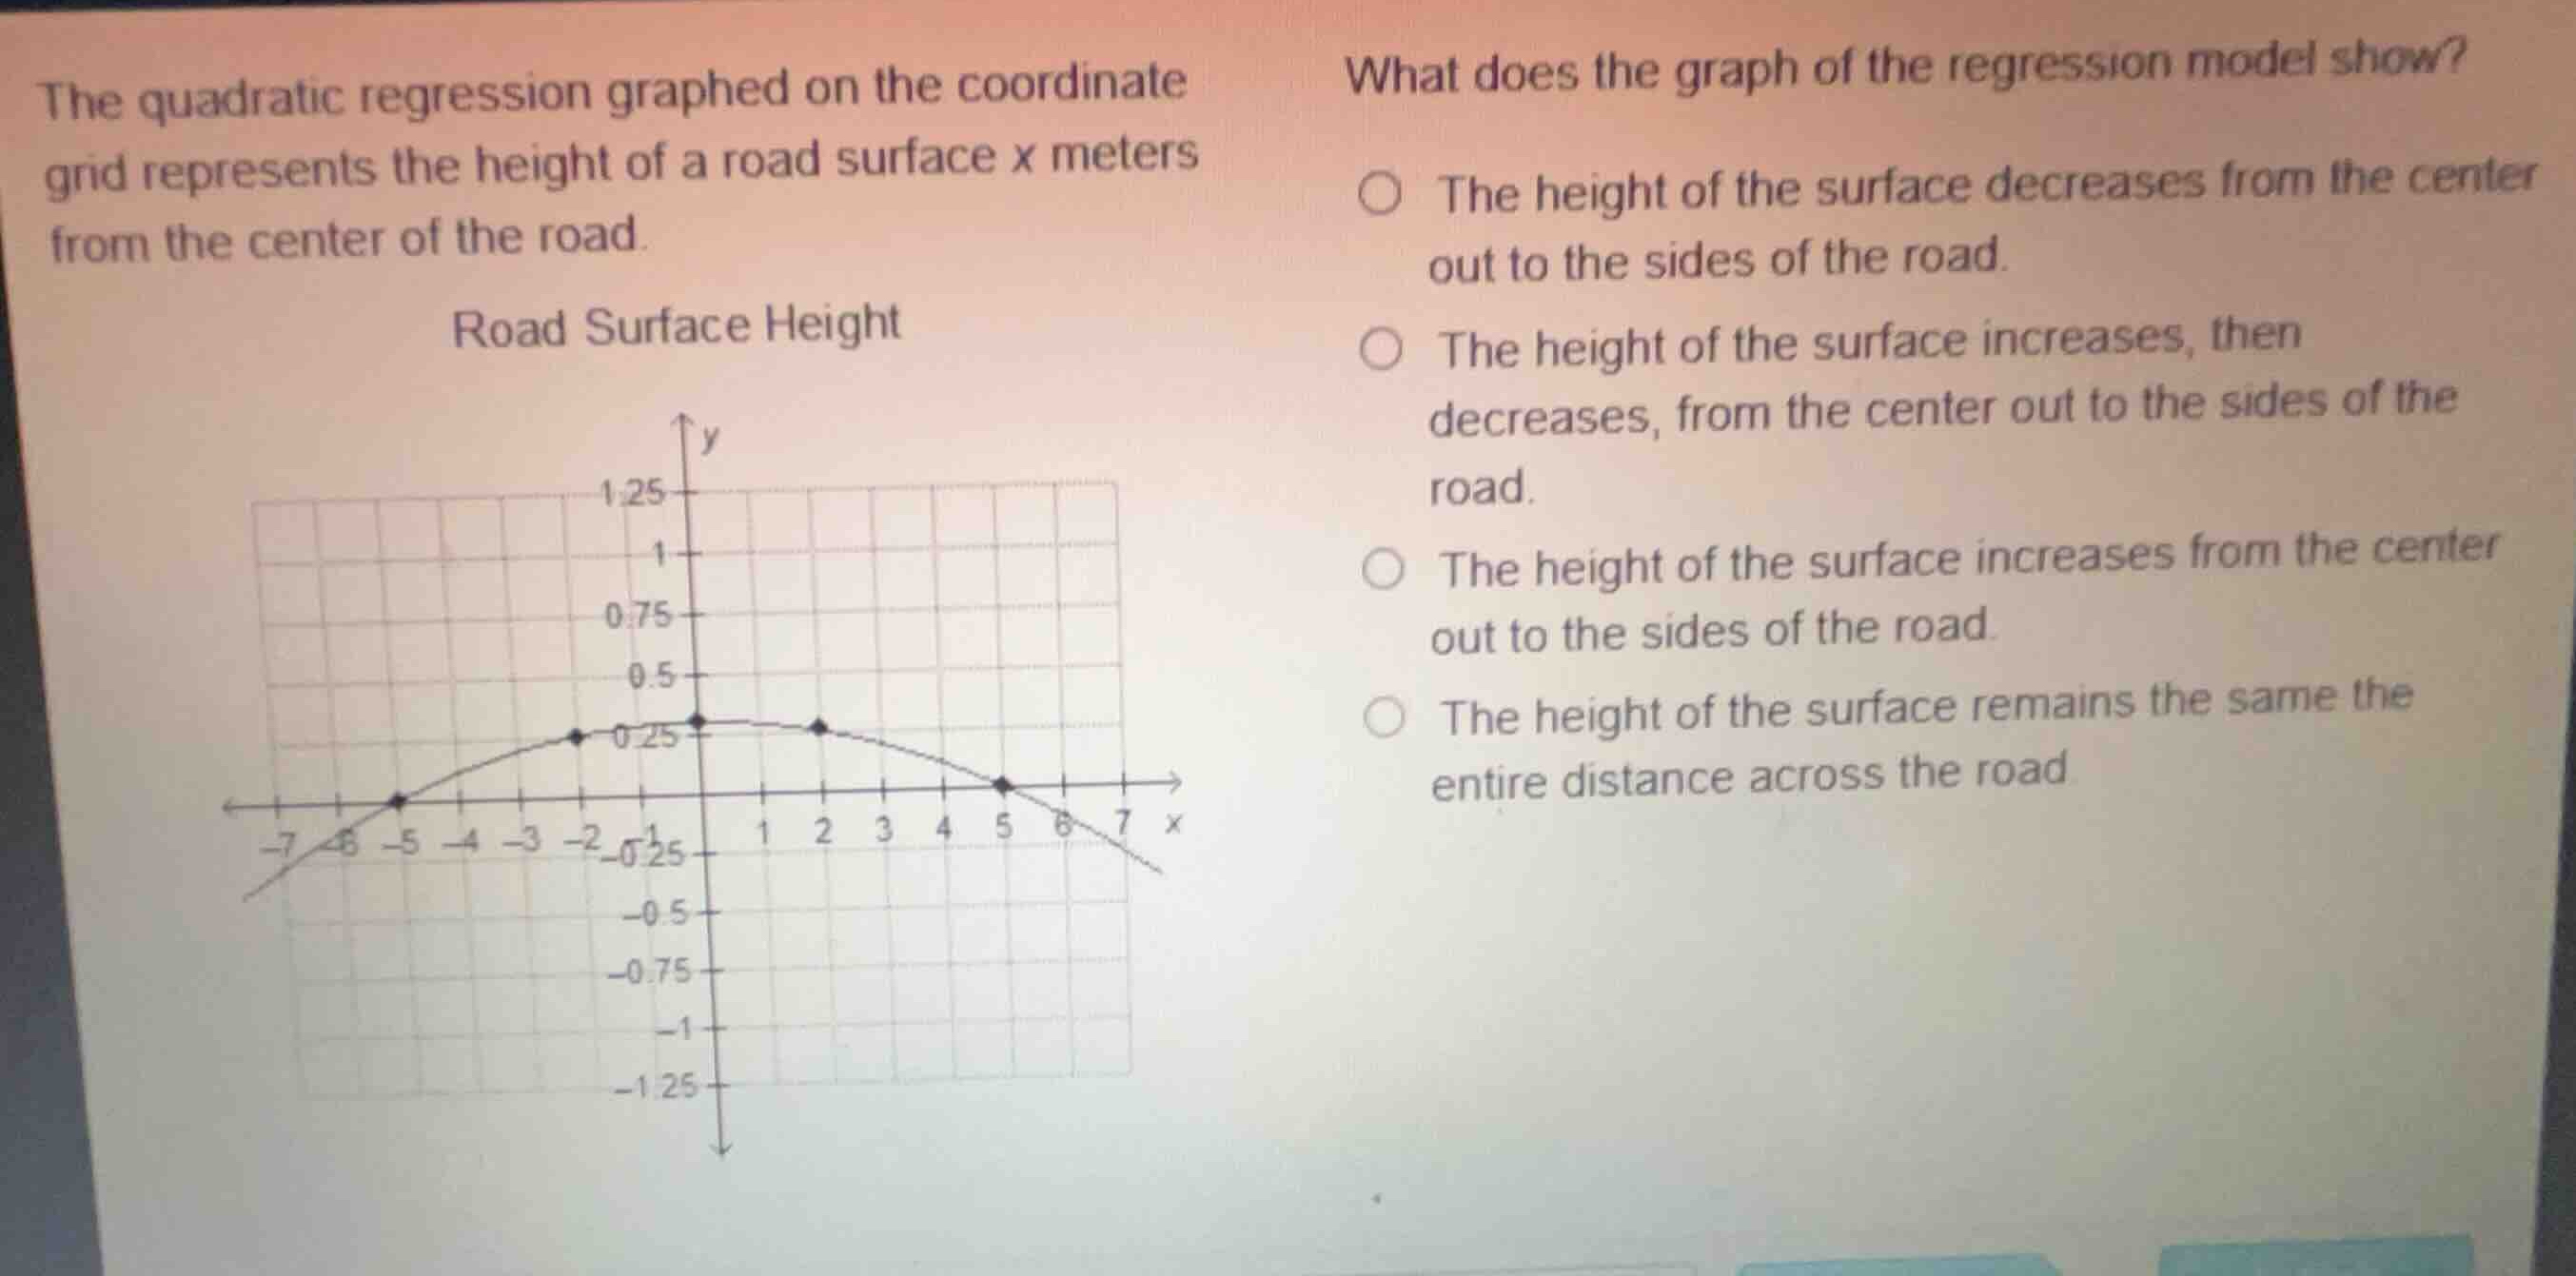
the quadratic regression graphed on the coordinate grid represents the height of a road surface x meters from the center of the road.
what does the graph of the regression model show?
- the height of the surface decreases from the center out to the sides of the road.
- the height of the surface increases, then decreases, from the center out to the sides of the road.
- the height of the surface increases from the center out to the sides of the road.
- the height of the surface remains the same the entire distance across the road.
Analyze the variables and axes
The horizontal axis \(x\) represents the distance in meters from the center of the road (\(x = 0\)).
The vertical axis \(y\) represents the height of the road surface in meters.
Interpret the shape of the graph
The graph is a downward-opening parabola with its vertex (maximum height) at \(x = 0\), which is the center of the road.
As the distance \(x\) moves away from the center (\(x = 0\)) in either direction (positive or negative), the height \(y\) decreases.
Match with the given options
The graph shows that the height of the surface decreases as you move from the center out to the sides of the road.
This matches the first option.

Snap & solve any problem in the app
Get step-by-step solutions on Sovi AI
Photo-based solutions with guided steps
Explore more problems and detailed explanations
- (A) The height of the surface decreases from the center out to the sides of the road. (Correct answer)
- (B) The height of the surface increases, then decreases, from the center out to the sides of the road.
- (C) The height of the surface increases from the center out to the sides of the road.
- (D) The height of the surface remains the same the entire distance across the road.