QUESTION IMAGE
Question
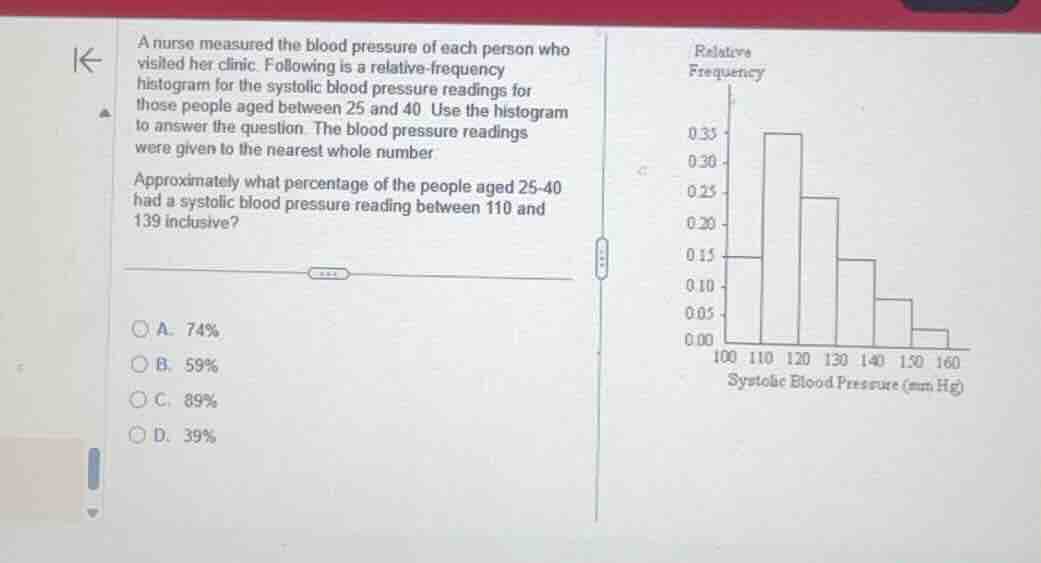
a nurse measured the blood pressure of each person who visited her clinic. following is a relative-frequency histogram for the systolic blood pressure readings for those people aged between 25 and 40. use the histogram to answer the question. the blood pressure readings were given to the nearest whole number.
approximately what percentage of the people aged 25-40 had a systolic blood pressure reading between 110 and 139 inclusive?
a. 74%
b. 59%
c. 89%
d. 39%
⚡ Using what you learned: displaying data: histograms & box plots
Step 1: Identify the relevant intervals
The question asks for the percentage of people with a systolic blood pressure reading between \(110\) and \(139\) inclusive. Looking at the horizontal axis of the histogram, this range corresponds to three bins:
- \(110\) to under \(120\)
- \(120\) to under \(130\)
- \(130\) to under \(140\)
Step 2: Read the relative frequencies
Find the height of each corresponding bar on the vertical axis:
- For \(110 - 120\): \(0.35\)
- For \(120 - 130\): \(0.24\)
- For \(130 - 140\): \(0.15\)
Step 3: Calculate the total percentage
Sum the relative frequencies and convert to a percentage:

Snap & solve any problem in the app
Get step-by-step solutions on Sovi AI
Photo-based solutions with guided steps
Explore more problems and detailed explanations
A. 74%