QUESTION IMAGE
Question
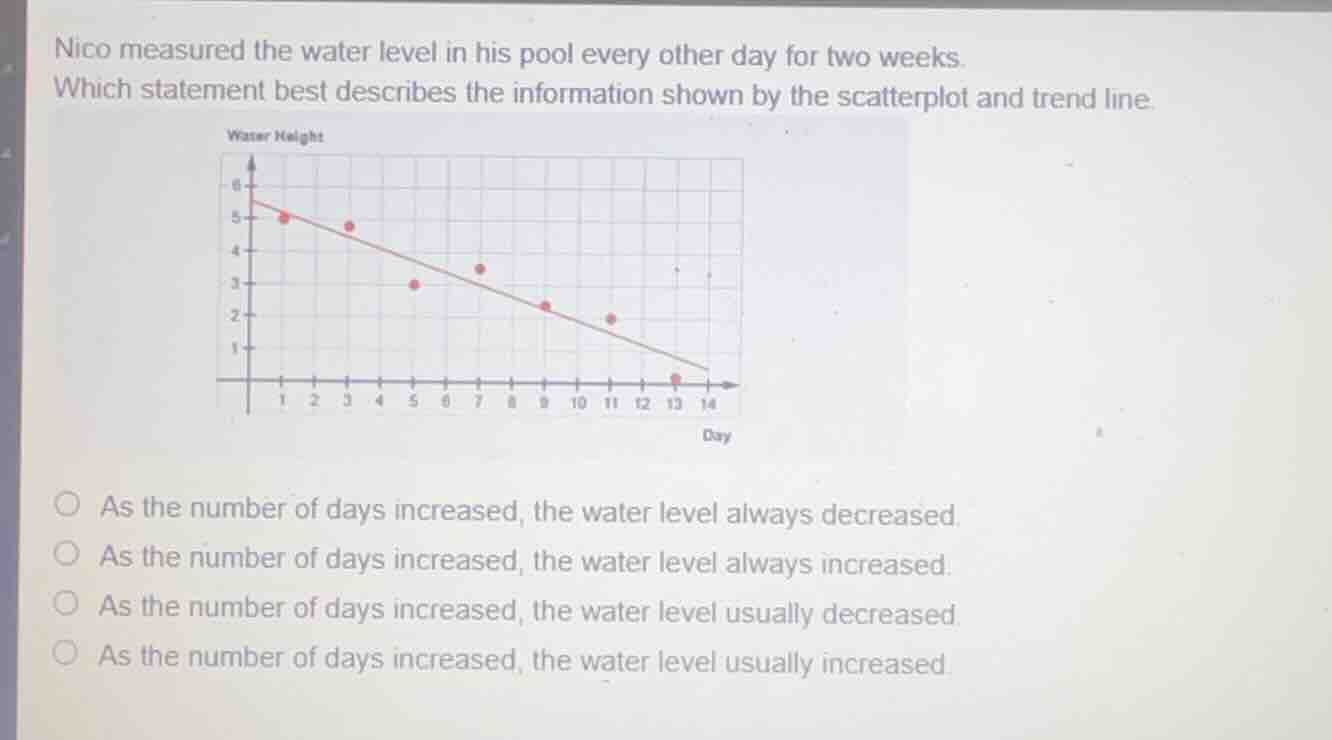
nico measured the water level in his pool every other day for two weeks.
which statement best describes the information shown by the scatterplot and trend line.
as the number of days increased, the water level always decreased.
as the number of days increased, the water level always increased.
as the number of days increased, the water level usually decreased.
as the number of days increased, the water level usually increased.
Analyze the scatterplot trend
Using the Scatterplot Analysis and Correlation Types knowledge points
- The horizontal axis represents the "Day" (independent variable).
- The vertical axis represents the "Water Height" (dependent variable).
- The plotted data points are: \((1, 5)\), \((3, 4.75)\), \((5, 3)\), \((7, 3.5)\), \((9, 2.25)\), \((11, 1.9)\), \((13, 0)\).
- The trend line (line of best fit) slopes downward from left to right, indicating a negative correlation.
Evaluate the word "always" vs "usually"
Using the Scatterplot Analysis knowledge point
- Looking at the individual data points:
- From Day 3 to Day 5, the water level decreases from \(4.75\) to \(3\).
- From Day 5 to Day 7, the water level increases from \(3\) to \(3.5\).
- Because the water level increased between Day 5 and Day 7, it did not always decrease.
- Therefore, the overall downward trend shows that the water level usually decreased as the number of days increased.

Snap & solve any problem in the app
Get step-by-step solutions on Sovi AI
Photo-based solutions with guided steps
Explore more problems and detailed explanations
- As the number of days increased, the water level always decreased.
- As the number of days increased, the water level always increased.
- As the number of days increased, the water level usually decreased. (Correct answer)
- As the number of days increased, the water level usually increased.