QUESTION IMAGE
Question
multiple choice question
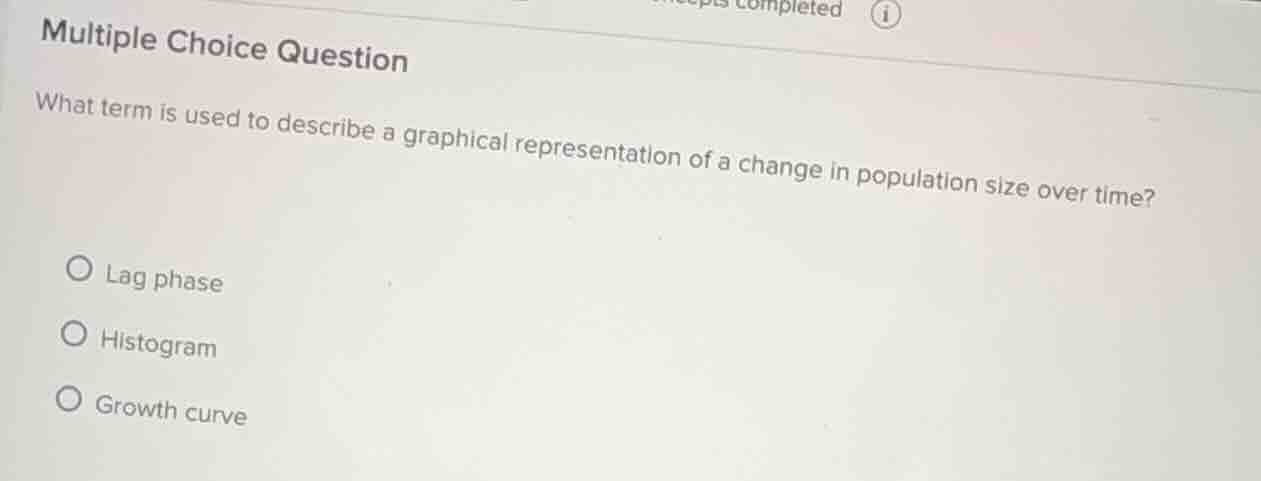
what term is used to describe a graphical representation of a change in population size over time?
lag phase
histogram
growth curve
Analyze the question prompt
The question asks for the term used to describe a graphical representation of a change in population size over time.
Evaluate the given options
- Lag phase: This is a specific phase of a bacterial growth curve, not the entire graphical representation itself.
- Histogram: This is a general statistical bar graph showing frequency distributions, not specifically population size over time.
- Growth curve: This is the standard biological term for a graph plotting the increase in population size (usually on a logarithmic scale) against time.
Select the correct option
The term that matches the definition is "Growth curve".

Snap & solve any problem in the app
Get step-by-step solutions on Sovi AI
Photo-based solutions with guided steps
Explore more problems and detailed explanations
- Lag phase
- Histogram
- Growth curve (Correct answer)