QUESTION IMAGE
Question
a misleading graph is a statistical graph that is not drawn appropriately. this type of graph can misrepresent data and lead to false conclusions.
(a) explain why the graph is misleading.
(b) redraw the graph so that it is not misleading.
b. the area for the 3rd quarter sales is drawn artificially larger than the area for the other quarters.
c. there is a gap between the quarter values.
d. the large gap in the vertical axis makes it appear that the sales for the 3rd quarter are disproportionately larger than the other quarters.
(b) choose the correct graph below.
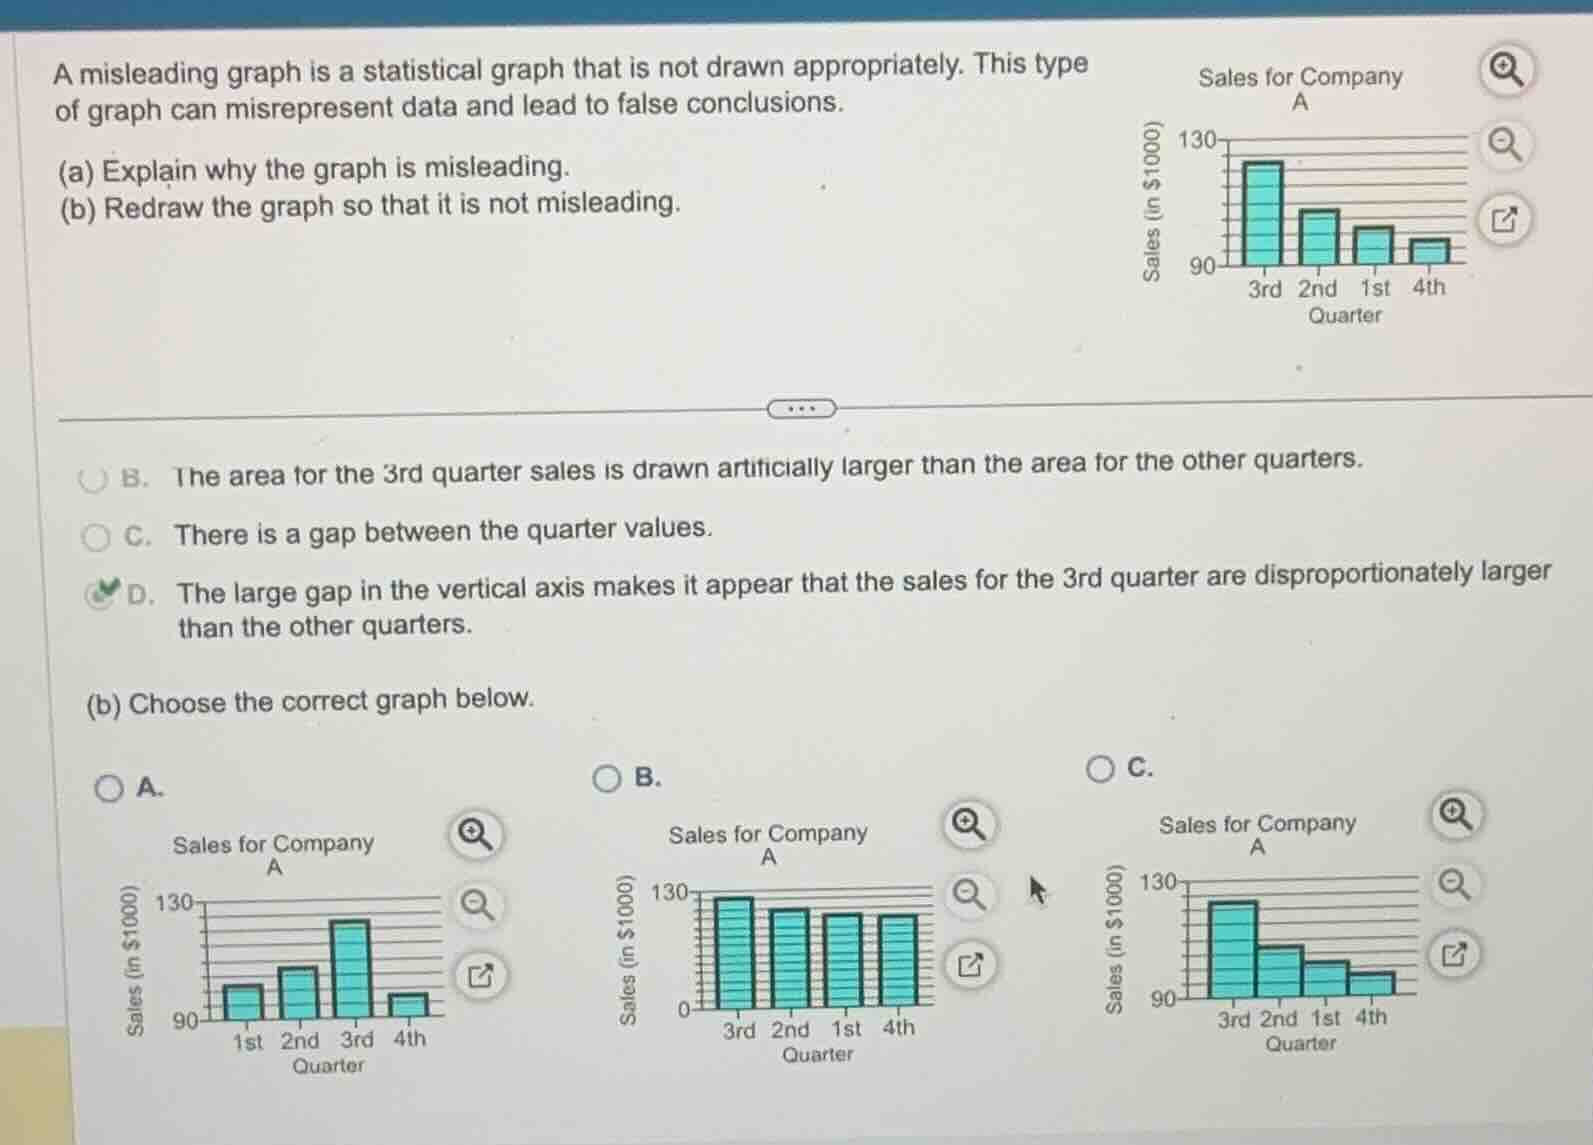
Analyze the vertical axis of the original graph
The vertical axis of the original graph starts at 90 instead of 0. This truncation exaggerates the differences between the sales of the quarters, making the 3rd quarter sales look disproportionately larger than the others.
Identify the correct explanation
The correct explanation for why the graph is misleading is that the vertical axis does not start at 0 (or has a large gap/truncation), which exaggerates the differences. This corresponds to option D: "The large gap in the vertical axis makes it appear that the sales for the 3rd quarter are disproportionately larger than the other quarters."
Select the non-misleading graph
To make the graph not misleading, the vertical axis should start at 0 so that the heights of the bars are proportional to the actual sales values.
- Graph A starts at 90 and rearranges the quarters chronologically, but still has a truncated axis.
- Graph B starts at 0, which correctly represents the relative proportions of the sales.
- Graph C is identical to the original misleading graph starting at 90.
Therefore, Graph B is the correct non-misleading graph.

Snap & solve any problem in the app
Get step-by-step solutions on Sovi AI
Photo-based solutions with guided steps
Explore more problems and detailed explanations
Question 1
- B. The area for the 3rd quarter sales is drawn artificially larger than the area for the other quarters.
- C. There is a gap between the quarter values.
- D. The large gap in the vertical axis makes it appear that the sales for the 3rd quarter are disproportionately larger than the other quarters. (Correct answer)
Question 2
- A.
- B. (Correct answer)
- C.