QUESTION IMAGE
Question
measures of center
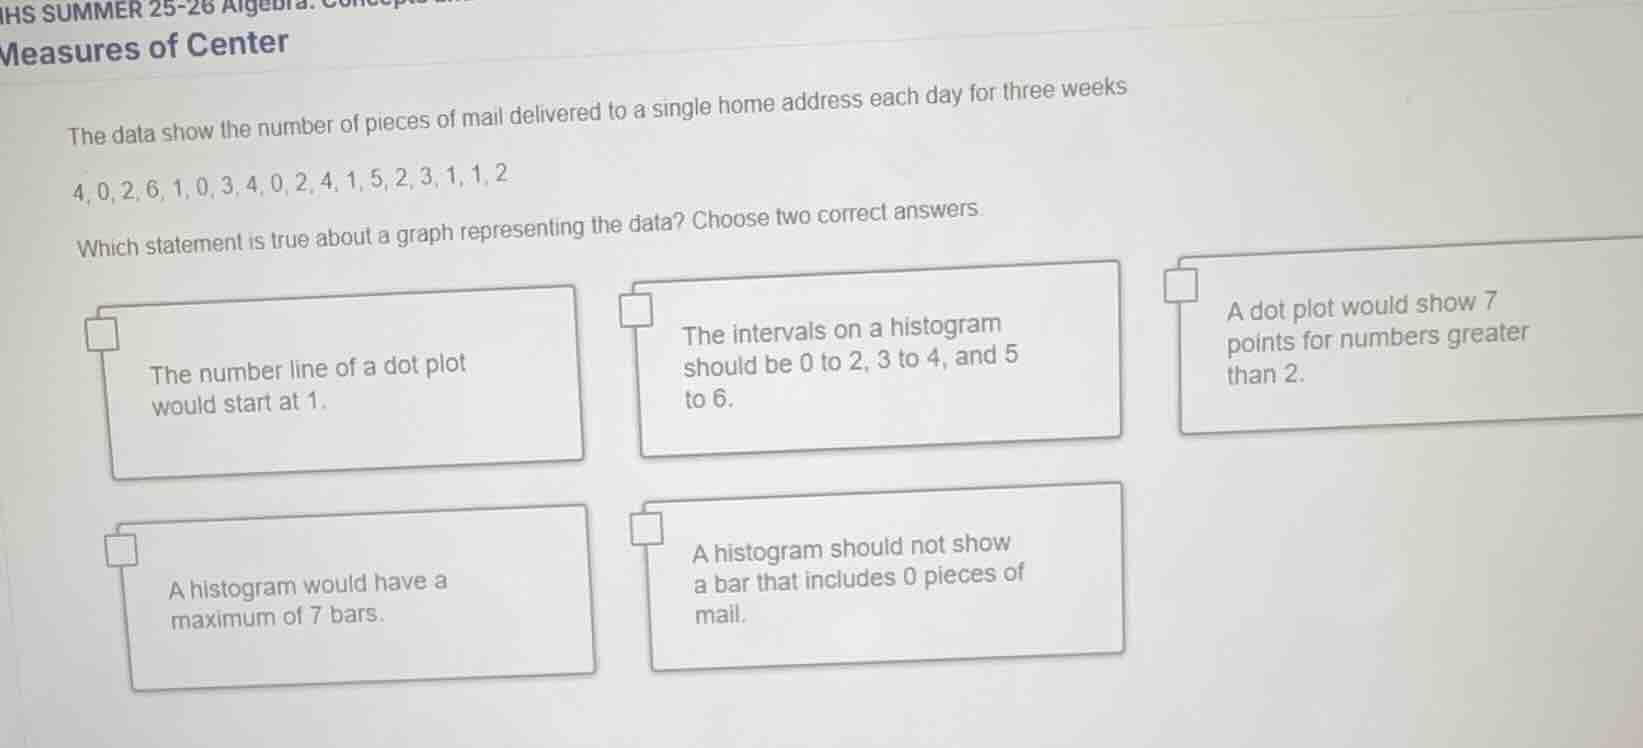
the data show the number of pieces of mail delivered to a single home address each day for three weeks.
(4, 0, 2, 6, 1, 0, 3, 4, 0, 2, 4, 1, 5, 2, 3, 1, 1, 2)
which statement is true about a graph representing the data? choose two correct answers.
- the number line of a dot plot would start at 1.
- the intervals on a histogram should be 0 to 2, 3 to 4, and 5 to 6.
- a dot plot would show 7 points for numbers greater than 2.
- a histogram would have a maximum of 7 bars.
- a histogram should not show a bar that includes 0 pieces of mail.
<pre_analysis>
{
"quality": "clear",
"question_count": 1,
"skills_matched": [
"step_cot",
"multiple_choice_formatter",
"explain_then_answer",
"tutor"
],
"needs_drawing": false,
"concepts_used": [],
"new_concepts": [
"Dot Plot Representation",
"Histogram Binning"
],
"current_concepts": [
"Dot Plot Representation",
"Histogram Binning",
"Graphical Interpretation"
]
}
</pre_analysis>
<reasoning>
Analyze the given data set
The data set represents the number of pieces of mail delivered each day for three weeks (21 days):
\[
4, 0, 2, 6, 1, 0, 3, 4, 0, 2, 4, 1, 5, 2, 3, 1, 1, 2
\]
Let's count the frequency of each value:
- \(0\): 3 times
- \(1\): 4 times
- \(2\): 4 times
- \(3\): 2 times
- \(4\): 3 times
- \(5\): 1 time
- \(6\): 1 time
Total count: \(3 + 4 + 4 + 2 + 3 + 1 + 1 = 18\) values (note: three weeks is 21 days, but only 18 data points are listed in the text). We will use the 18 visible values.
Evaluate the dot plot statements
- Statement 1: "The number line of a dot plot would start at 1."
Since the minimum value in the data set is \(0\), the number line of a dot plot must start at \(0\) or lower to include all data points. Thus, this statement is false.
- Statement 2: "A dot plot would show 7 points for numbers greater than 2."
The numbers greater than 2 are \(3, 4, 5, 6\).
Let's count their occurrences:
- \(3\): 2 times
- \(4\): 3 times
- \(5\): 1 time
- \(6\): 1 time
Total points greater than 2: \(2 + 3 + 1 + 1 = 7\).
Thus, this statement is true.
Evaluate the histogram statements
- Statement 3: "The intervals on a histogram should be 0 to 2, 3 to 4, and 5 to 6."
Histogram intervals (bins) must be of equal width.
- Interval \(0\) to \(2\) contains 3 integers: \(\{0, 1, 2\}\) (width = 3).
- Interval \(3\) to \(4\) contains 2 integers: \(\{3, 4\}\) (width = 2).
- Interval \(5\) to \(6\) contains 2 integers: \(\{5, 6\}\) (width = 2).
Since the intervals do not have equal widths, this is not a standard or correct way to set up the histogram bins. Thus, this statement is false.
- Statement 4: "A histogram would have a maximum of 7 bars."
If each integer from \(0\) to \(6\) is plotted in its own bin (interval width of 1), there would be 7 bars (for \(0, 1, 2, 3, 4, 5, 6\)). Since the range of data is from \(0\) to \(6\), any standard grouping with integer bin widths of 1 or more will result in at most 7 bars. Thus, this statement is true.
- Statement 5: "A histogram should not show a bar that includes 0 pieces of mail."
Since \(0\) is a valid data point with a frequency of 3, the histogram must include a bar representing \(0\) to accurately display the data distribution. Thus, this statement is false.
Select the two correct statements
Based on our analysis:
- "A dot plot would show 7 points for numbers greater than 2." (True)
- "A histogram would have a maximum of 7 bars." (True)
</reasoning>
<answer>
<mcq-option>The number line of a dot plot would start at 1.</mcq-option>
<mcq-option>The intervals on a histogram should be 0 to 2, 3 to 4, and 5 to 6.</mcq-option>
<mcq-correct>A dot plot would show 7 points for numbers greater than 2.</mcq-correct>
<mcq-correct>A histogram would have a maximum of 7 bars.</mcq-correct>
<mcq-option>A histogram should not show a bar that includes 0 pieces of mail.</mcq-option>
</answer>
<post_analysis>
{
"subject": "Mathematics",
"question_type": "Multiple Choice",
"knowledge_point": [
"Mathematics",
"Statistics",
"Graphical Interpretation"
]
}
</post_analysis>

Snap & solve any problem in the app
Get step-by-step solutions on Sovi AI
Photo-based solutions with guided steps
Explore more problems and detailed explanations
<pre_analysis>
{
"quality": "clear",
"question_count": 1,
"skills_matched": [
"step_cot",
"multiple_choice_formatter",
"explain_then_answer",
"tutor"
],
"needs_drawing": false,
"concepts_used": [],
"new_concepts": [
"Dot Plot Representation",
"Histogram Binning"
],
"current_concepts": [
"Dot Plot Representation",
"Histogram Binning",
"Graphical Interpretation"
]
}
</pre_analysis>
<reasoning>
Analyze the given data set
The data set represents the number of pieces of mail delivered each day for three weeks (21 days):
\[
4, 0, 2, 6, 1, 0, 3, 4, 0, 2, 4, 1, 5, 2, 3, 1, 1, 2
\]
Let's count the frequency of each value:
- \(0\): 3 times
- \(1\): 4 times
- \(2\): 4 times
- \(3\): 2 times
- \(4\): 3 times
- \(5\): 1 time
- \(6\): 1 time
Total count: \(3 + 4 + 4 + 2 + 3 + 1 + 1 = 18\) values (note: three weeks is 21 days, but only 18 data points are listed in the text). We will use the 18 visible values.
Evaluate the dot plot statements
- Statement 1: "The number line of a dot plot would start at 1."
Since the minimum value in the data set is \(0\), the number line of a dot plot must start at \(0\) or lower to include all data points. Thus, this statement is false.
- Statement 2: "A dot plot would show 7 points for numbers greater than 2."
The numbers greater than 2 are \(3, 4, 5, 6\).
Let's count their occurrences:
- \(3\): 2 times
- \(4\): 3 times
- \(5\): 1 time
- \(6\): 1 time
Total points greater than 2: \(2 + 3 + 1 + 1 = 7\).
Thus, this statement is true.
Evaluate the histogram statements
- Statement 3: "The intervals on a histogram should be 0 to 2, 3 to 4, and 5 to 6."
Histogram intervals (bins) must be of equal width.
- Interval \(0\) to \(2\) contains 3 integers: \(\{0, 1, 2\}\) (width = 3).
- Interval \(3\) to \(4\) contains 2 integers: \(\{3, 4\}\) (width = 2).
- Interval \(5\) to \(6\) contains 2 integers: \(\{5, 6\}\) (width = 2).
Since the intervals do not have equal widths, this is not a standard or correct way to set up the histogram bins. Thus, this statement is false.
- Statement 4: "A histogram would have a maximum of 7 bars."
If each integer from \(0\) to \(6\) is plotted in its own bin (interval width of 1), there would be 7 bars (for \(0, 1, 2, 3, 4, 5, 6\)). Since the range of data is from \(0\) to \(6\), any standard grouping with integer bin widths of 1 or more will result in at most 7 bars. Thus, this statement is true.
- Statement 5: "A histogram should not show a bar that includes 0 pieces of mail."
Since \(0\) is a valid data point with a frequency of 3, the histogram must include a bar representing \(0\) to accurately display the data distribution. Thus, this statement is false.
Select the two correct statements
Based on our analysis:
- "A dot plot would show 7 points for numbers greater than 2." (True)
- "A histogram would have a maximum of 7 bars." (True)
</reasoning>
<answer>
<mcq-option>The number line of a dot plot would start at 1.</mcq-option>
<mcq-option>The intervals on a histogram should be 0 to 2, 3 to 4, and 5 to 6.</mcq-option>
<mcq-correct>A dot plot would show 7 points for numbers greater than 2.</mcq-correct>
<mcq-correct>A histogram would have a maximum of 7 bars.</mcq-correct>
<mcq-option>A histogram should not show a bar that includes 0 pieces of mail.</mcq-option>
</answer>
<post_analysis>
{
"subject": "Mathematics",
"question_type": "Multiple Choice",
"knowledge_point": [
"Mathematics",
"Statistics",
"Graphical Interpretation"
]
}
</post_analysis>