QUESTION IMAGE
Question
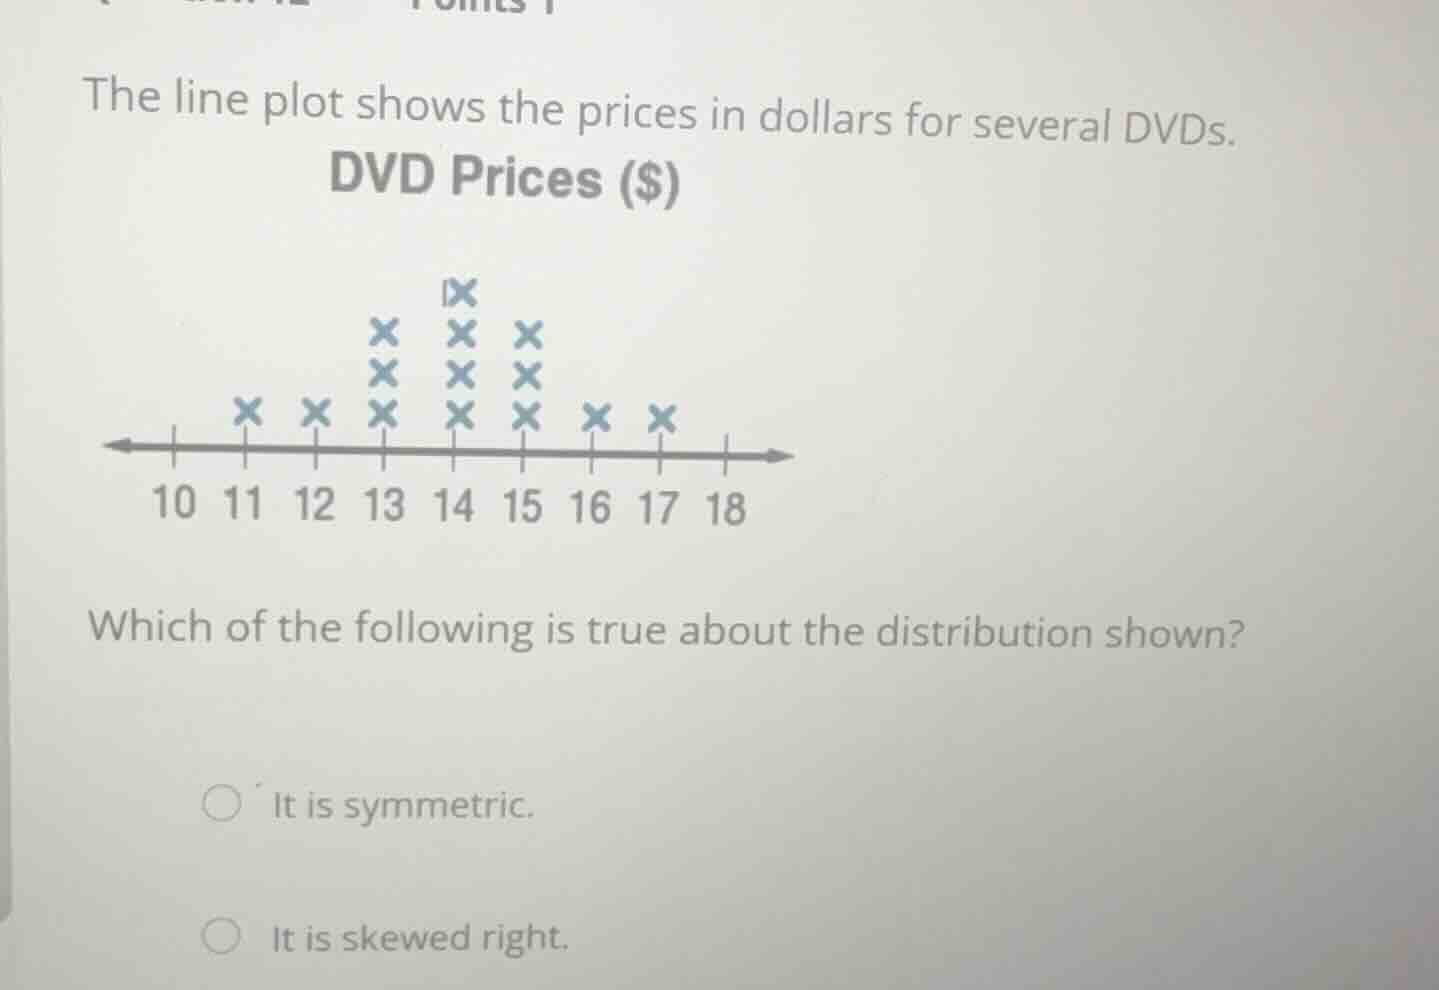
the line plot shows the prices in dollars for several dvds.
dvd prices ($)
which of the following is true about the distribution shown?
it is symmetric.
it is skewed right.
Analyze the line plot data
Using the Data Distribution Shape knowledge point
- The line plot displays the frequency of DVD prices:
- \$11: 1
- \$12: 1
- \$13: 3
- \$14: 4 (the peak/center)
- \$15: 3
- \$16: 1
- \$17: 1
Determine the symmetry of the distribution
Using the Data Distribution Shape knowledge point
- The peak is at \$14.
- The frequencies on the left side of the peak (\$13, \$12, \$11) are 3, 1, 1.
- The frequencies on the right side of the peak (\$15, \$16, \$17) are 3, 1, 1.
- Since the left and right sides are perfect mirror images of each other, the distribution is symmetric.

Snap & solve any problem in the app
Get step-by-step solutions on Sovi AI
Photo-based solutions with guided steps
Explore more problems and detailed explanations
- It is symmetric. (Correct answer)
- It is skewed right.