QUESTION IMAGE
Question
identifying data sets that have outliers
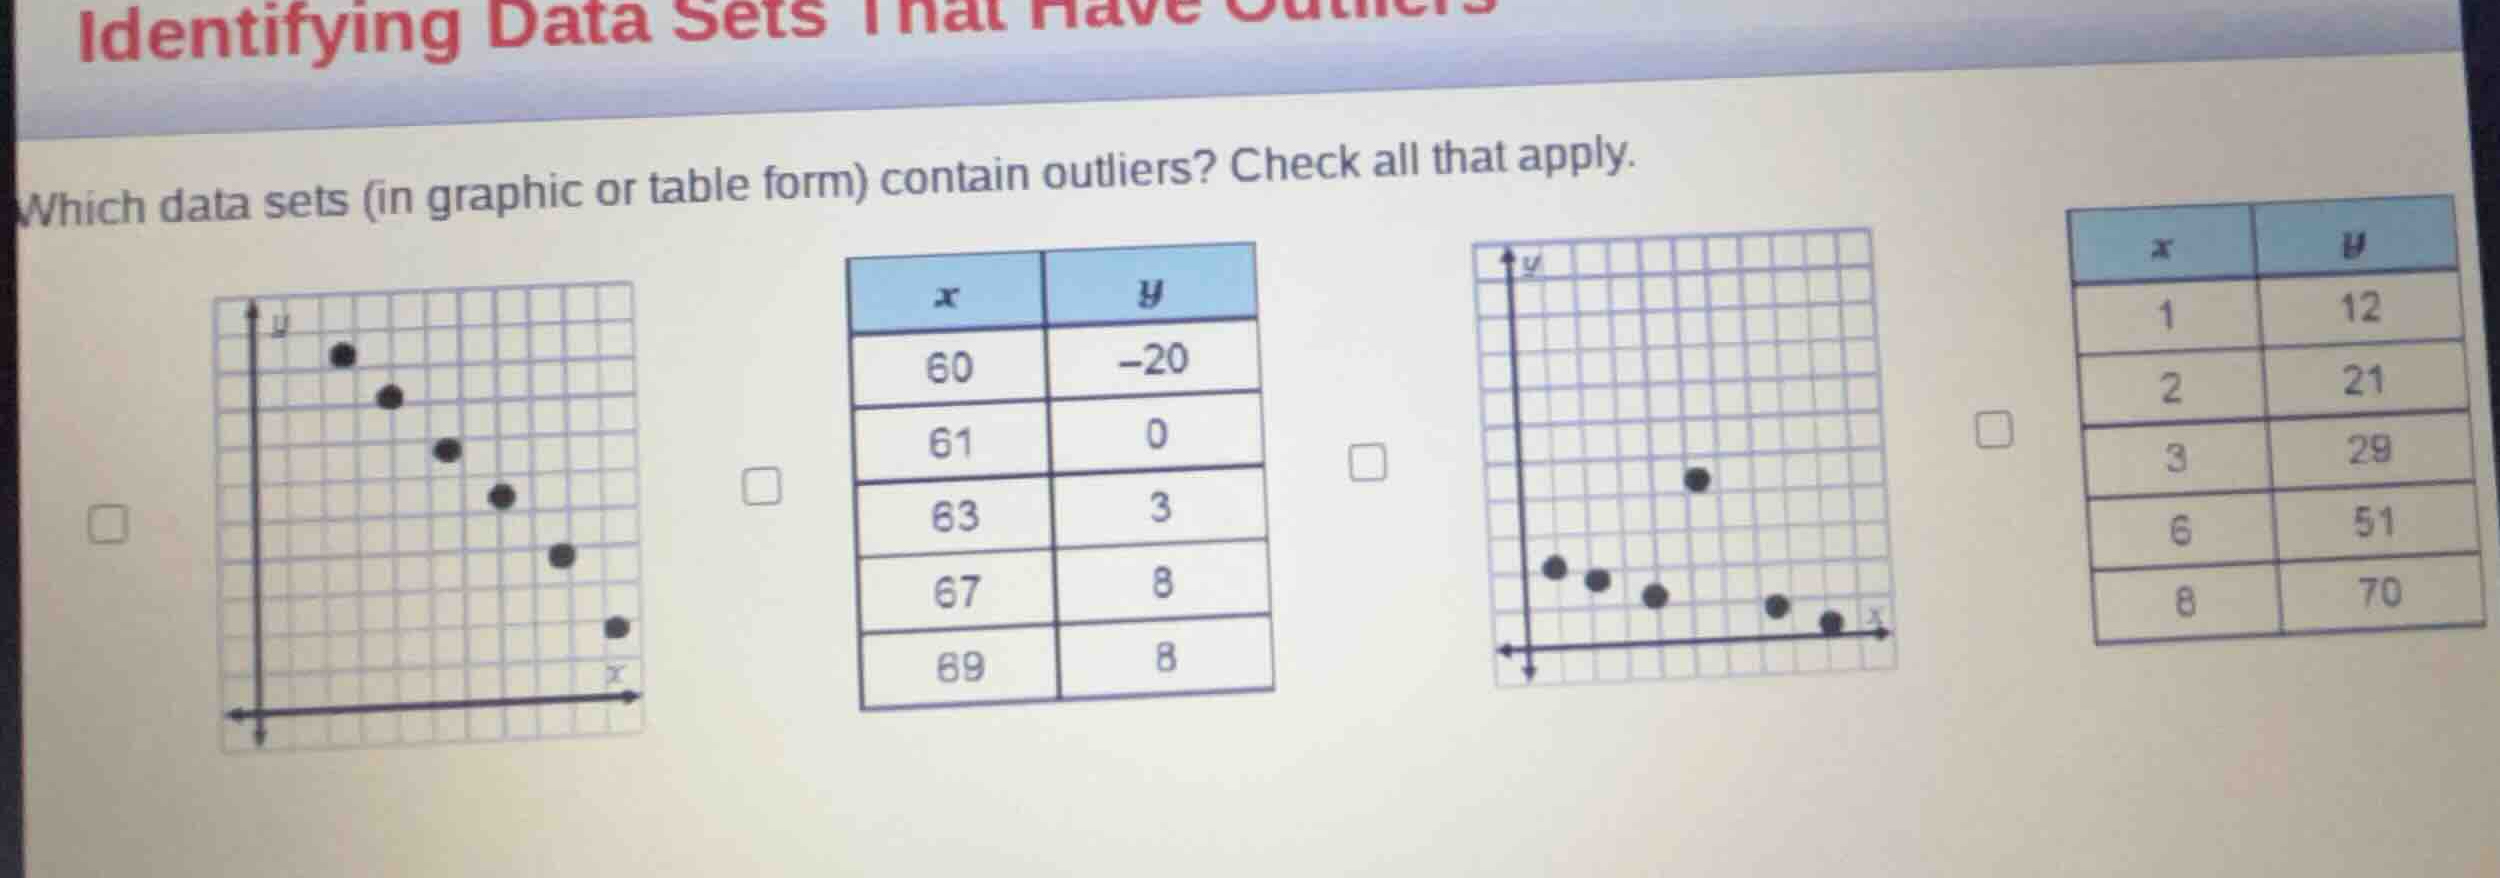
which data sets (in graphic or table form) contain outliers? check all that apply.
Analyze the first scatterplot and second table
The first scatterplot shows points that lie perfectly along a straight line with a negative slope. There are no points deviating from this linear pattern, so it contains no outliers.
The first table has the following data points: \((60, -20)\), \((61, 0)\), \((63, 3)\), \((67, 8)\), and \((69, 8)\).
As \(x\) increases from \(61\) to \(69\), \(y\) increases gradually from \(0\) to \(8\). However, the point \((60, -20)\) has a \(y\)-value that is extremely far below the rest of the trend, making it a clear outlier.
Analyze the third scatterplot and fourth table
The second scatterplot shows a series of points following a decreasing curve or line, except for one point located significantly above the rest of the data trend at approximately \(x = 6\). This point is a clear outlier.
The second table has the following data points: \((1, 12)\), \((2, 21)\), \((3, 29)\), \((6, 51)\), and \((8, 70)\).
Calculating the rate of change between consecutive points:
- From \(x=1\) to \(x=2\): \(\Delta y / \Delta x = (21-12)/1 = 9\)
- From \(x=2\) to \(x=3\): \(\Delta y / \Delta x = (29-21)/1 = 8\)
- From \(x=3\) to \(x=6\): \(\Delta y / \Delta x = (51-29)/3 \approx 7.33\)
- From \(x=6\) to \(x=8\): \(\Delta y / \Delta x = (70-51)/2 = 9.5\)
All points follow a highly consistent, nearly linear positive relationship with a slope of approximately \(8\) to \(9\). There are no anomalous points deviating from this trend, so this data set contains no outliers.

Snap & solve any problem in the app
Get step-by-step solutions on Sovi AI
Photo-based solutions with guided steps
Explore more problems and detailed explanations
- (A) First scatterplot (linear downward trend with no deviating points)
- (B) Second data set (table with outlier at \((60, -20)\)) (Correct answer)
- (C) Third data set (scatterplot with one point plotted high above the downward trend) (Correct answer)
- (D) Fourth data set (table showing a consistent linear upward trend)