QUESTION IMAGE
Question
identify the mean of each distribution.
distribution a
mean =
distribution b
mean =
distribution c
mean =
Identify the line of symmetry for each curve
Using the Normal Distribution and Symmetric Distribution knowledge points
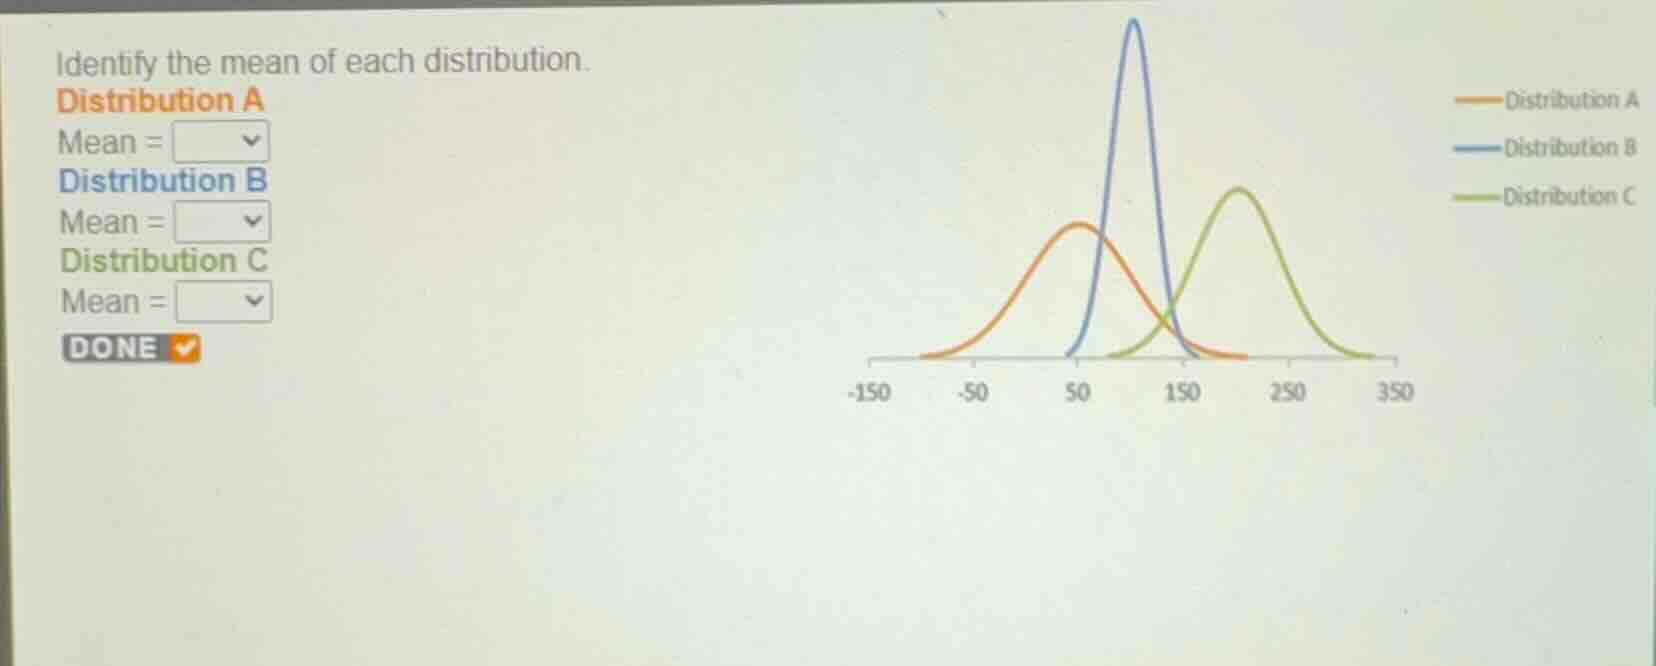
- For a symmetric normal distribution curve, the mean is located exactly at the horizontal position of its peak.
- Distribution A (orange curve): The peak is centered directly above the tick mark labeled \(50\).
- Distribution B (blue curve): The peak is centered directly above the tick mark labeled \(100\) (the midpoint between \(50\) and \(150\)).
- Distribution C (green curve): The peak is centered directly above the tick mark labeled \(200\) (the midpoint between \(150\) and \(250\)).

Snap & solve any problem in the app
Get step-by-step solutions on Sovi AI
Photo-based solutions with guided steps
Explore more problems and detailed explanations
Identify the mean of each distribution.
Distribution A
Mean = <blank>50</blank>
Distribution B
Mean = <blank>100</blank>
Distribution C
Mean = <blank>200</blank>