QUESTION IMAGE
Question
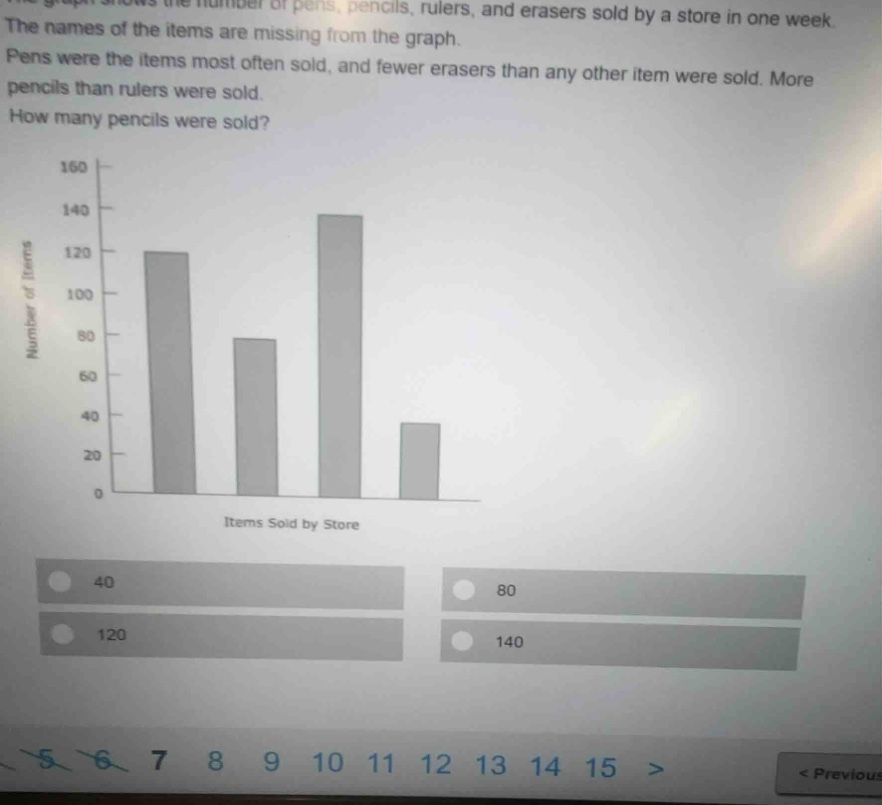
the graph shows the number of pens, pencils, rulers, and erasers sold by a store in one week. the names of the items are missing from the graph. pens were the items most often sold, and fewer erasers than any other item were sold. more pencils than rulers were sold. how many pencils were sold?
Identify the values of the bars from the graph
$$
LATEXBLOCK0
$$
Match items to the bars using the given clues
$$
LATEXBLOCK1
$$
Determine the number of pencils sold
$$
\text{Pencils sold} = 120
$$

Snap & solve any problem in the app
Get step-by-step solutions on Sovi AI
Photo-based solutions with guided steps
Explore more problems and detailed explanations
- 40
- 80
- 120 (Correct answer)
- 140