QUESTION IMAGE
Question
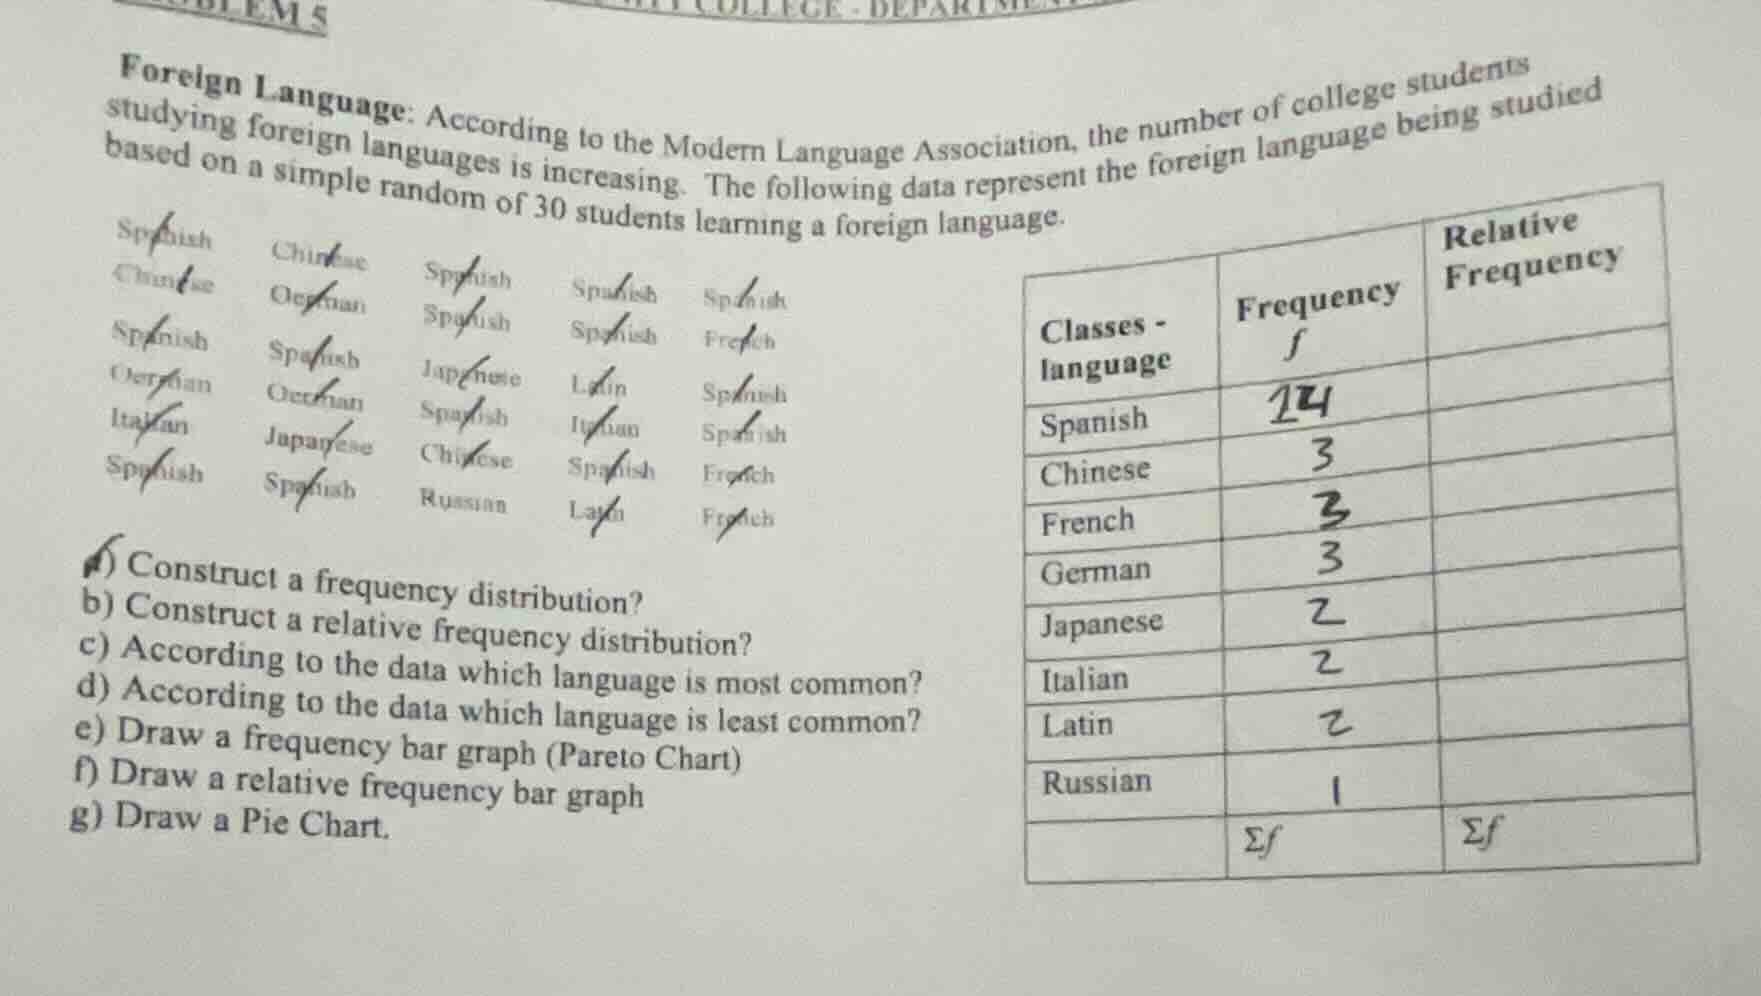
foreign language: according to the modern language association, the number of college students studying foreign languages is increasing. the following data represent the foreign language being studied based on a simple random of 30 students learning a foreign language.
spanish chinese spanish spanish spanish
chinese german spanish spanish french
spanish spanish japanese latin spanish
german german spanish italian spanish
italian japanese chinese spanish french
spanish spanish russian latin french
a) construct a frequency distribution?
b) construct a relative frequency distribution?
c) according to the data which language is most common?
d) according to the data which language is least common?
e) draw a frequency bar graph (pareto chart)
f) draw a relative frequency bar graph
g) draw a pie chart.
Count the frequencies
We count the occurrences of each language in the given list of 30 students:
- Spanish: 14
- Chinese: 3
- French: 3
- German: 3
- Japanese: 2
- Italian: 2
- Latin: 2
- Russian: 1
Total frequency sum:
Calculate relative frequencies
Relative frequency is calculated as:
- Spanish: \(\frac{14}{30} \approx 0.4667\)
- Chinese: \(\frac{3}{30} = 0.1000\)
- French: \(\frac{3}{30} = 0.1000\)
- German: \(\frac{3}{30} = 0.1000\)
- Japanese: \(\frac{2}{30} \approx 0.0667\)
- Italian: \(\frac{2}{30} \approx 0.0667\)
- Latin: \(\frac{2}{30} \approx 0.0667\)
- Russian: \(\frac{1}{30} \approx 0.0333\)
Total relative frequency sum:
Identify extreme values
- Most common language: Spanish (highest frequency of 14).
- Least common language: Russian (lowest frequency of 1).
Construct visual representations
- Pareto Chart: A bar graph where categories are sorted in descending order of frequency (Spanish, Chinese, French, German, Japanese, Italian, Latin, Russian).
- Relative Frequency Bar Graph: A bar graph showing relative frequencies on the vertical axis.
- Pie Chart: A circular chart where each sector's angle is proportional to its relative frequency:
- Spanish: \(0.4667 \times 360^\circ \approx 168^\circ\)
- Chinese, French, German: \(0.1000 \times 360^\circ = 36^\circ\) each
- Japanese, Italian, Latin: \(0.0667 \times 360^\circ \approx 24^\circ\) each
- Russian: \(0.0333 \times 360^\circ \approx 12^\circ\)

Snap & solve any problem in the app
Get step-by-step solutions on Sovi AI
Photo-based solutions with guided steps
Explore more problems and detailed explanations
Question a) & b) Frequency and Relative Frequency Distributions
| Classes - language | Frequency (\(f\)) | Relative Frequency |
|---|---|---|
| Chinese | 3 | 0.1000 |
| French | 3 | 0.1000 |
| German | 3 | 0.1000 |
| Japanese | 2 | 0.0667 |
| Italian | 2 | 0.0667 |
| Latin | 2 | 0.0667 |
| Russian | 1 | 0.0333 |
| Total (\(\sum\)) | 30 | 1.0000 |
Question c)
According to the data, the most common language is Spanish.
Question d)
According to the data, the least common language is Russian.
Question e), f) & g)
The visual representations (Pareto Chart, Relative Frequency Bar Graph, and Pie Chart) are plotted below.