QUESTION IMAGE
Question
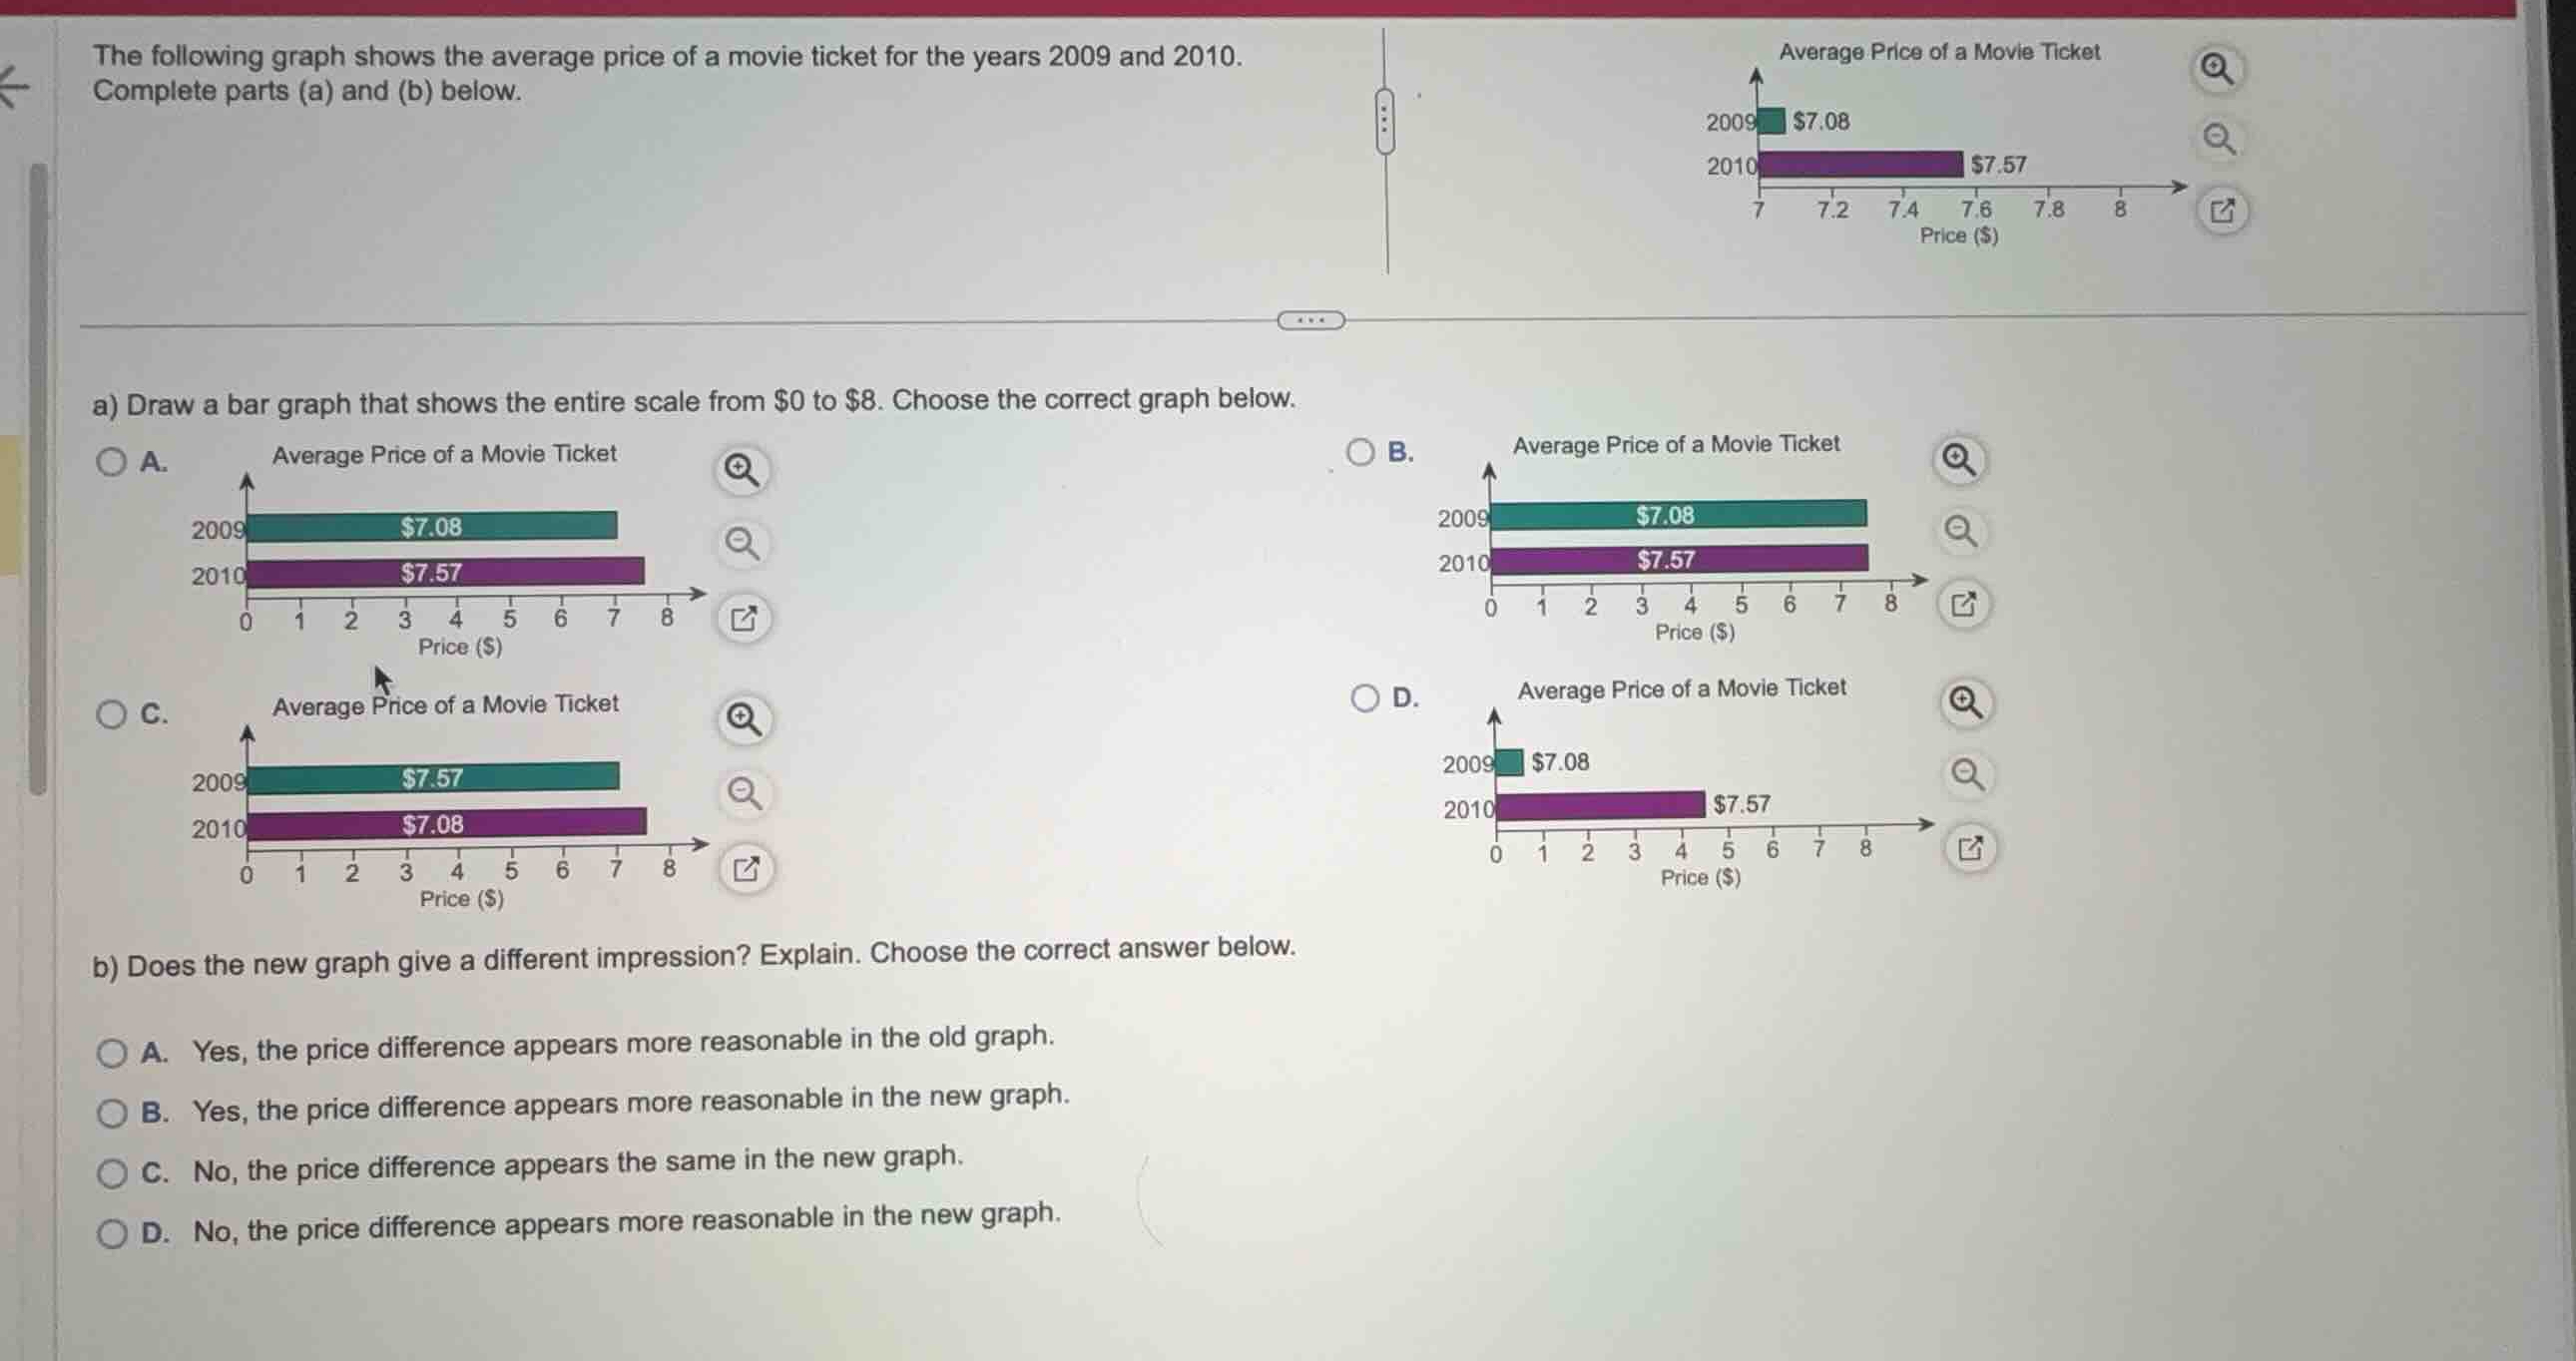
the following graph shows the average price of a movie ticket for the years 2009 and 2010. complete parts (a) and (b) below.
a) draw a bar graph that shows the entire scale from \\$0 to \\$8. choose the correct graph below.
b) does the new graph give a different impression? explain. choose the correct answer below.
a. yes, the price difference appears more reasonable in the old graph.
b. yes, the price difference appears more reasonable in the new graph.
c. no, the price difference appears the same in the new graph.
d. no, the price difference appears more reasonable in the new graph.
Identify the correct bar graph scale
Using the Bar Graph Construction knowledge point
- The original data values are: 2009 = \$7.08, 2010 = \$7.57.
- Part (a) asks for a bar graph showing the entire scale from \$0 to \$8.
- Graph A shows: 2009 bar ending slightly past 7 (\$7.08) and 2010 bar ending halfway between 7 and 8 (\$7.57). The scale starts at 0 and ends at 8.
- Graph B shows: 2009 bar ending past 7.5, which is incorrect.
- Graph C shows: 2009 bar as \$7.57 and 2010 bar as \$7.08, which swaps the years.
- Graph D shows: 2009 bar ending near 1, which is incorrect.
- Therefore, Graph A is the correct representation.
Analyze the visual impression of the scale
Using the Scale Distortion knowledge point
- In the original graph, the horizontal axis starts at \$7 and ends at \$8. This truncated scale exaggerates the difference between \$7.08 and \$7.57, making the 2010 price look several times larger than the 2009 price.
- In the new graph (Graph A), the scale starts at \$0. This shows the entire height of the bars, making the relative difference between \$7.08 and \$7.57 look small and proportional.
- Thus, the new graph gives a different, more reasonable (less distorted) impression of the price difference.
- This matches option B: "Yes, the price difference appears more reasonable in the new graph."

Snap & solve any problem in the app
Get step-by-step solutions on Sovi AI
Photo-based solutions with guided steps
Explore more problems and detailed explanations
Question 1
- (A) Graph A (Correct answer)
- (B) Graph B
- (C) Graph C
- (D) Graph D
Question 2
- (A) Yes, the price difference appears more reasonable in the old graph.
- (B) Yes, the price difference appears more reasonable in the new graph. (Correct answer)
- (C) No, the price difference appears the same in the new graph.
- (D) No, the price difference appears more reasonable in the new graph.