QUESTION IMAGE
Question
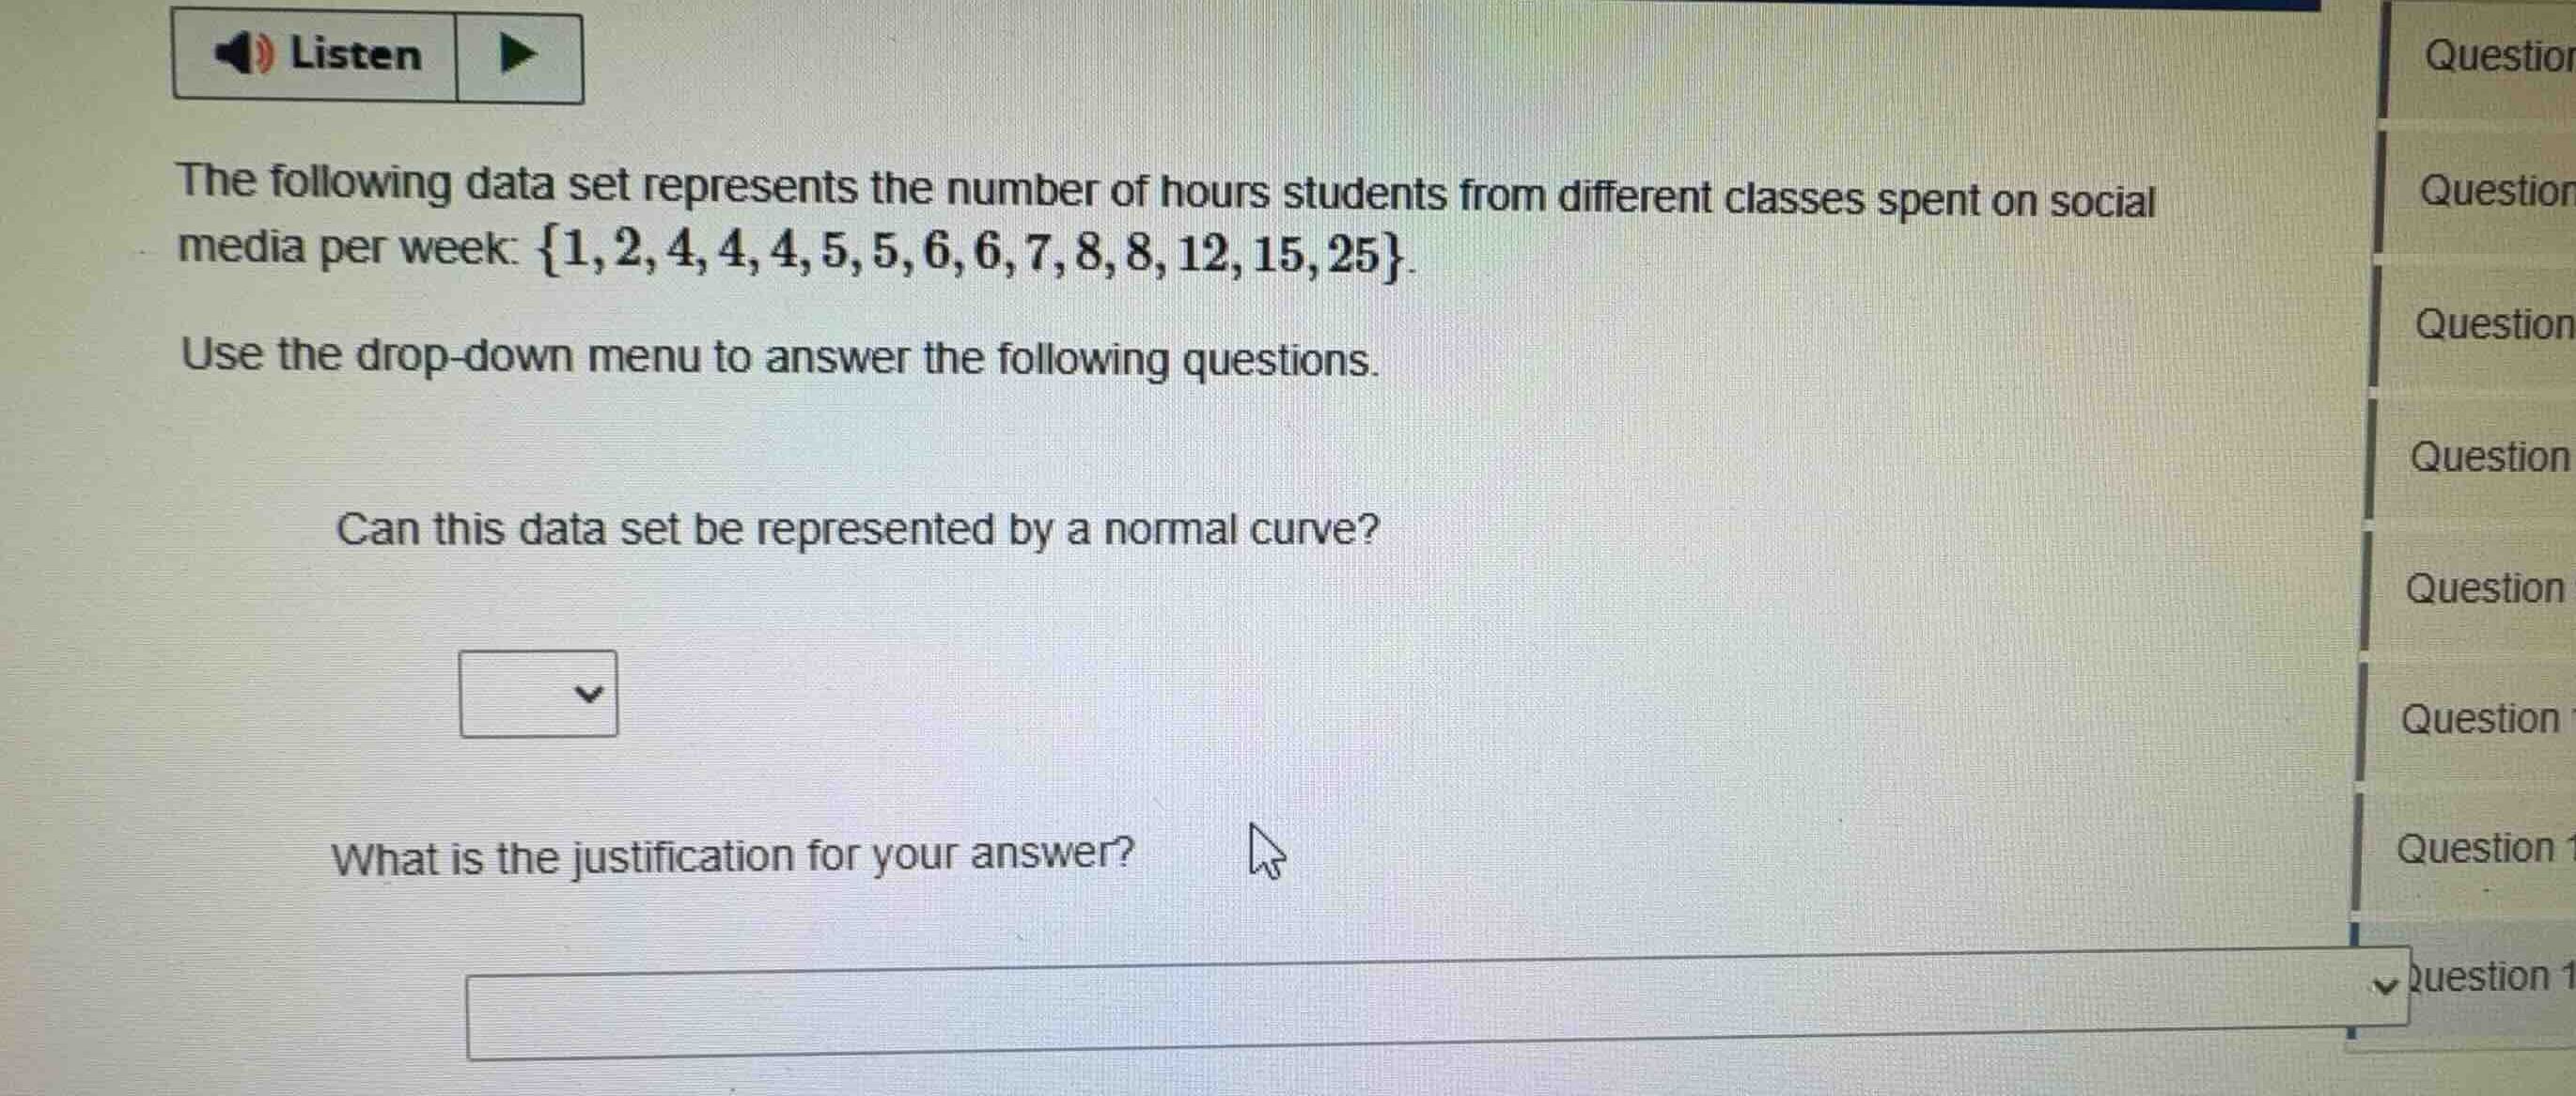
the following data set represents the number of hours students from different classes spent on social media per week: \\(\\{1, 2, 4, 4, 4, 5, 5, 6, 6, 7, 8, 8, 12, 15, 25\\}\\).
use the drop-down menu to answer the following questions.
can this data set be represented by a normal curve?
what is the justification for your answer?
Analyze the distribution symmetry
The data set is:
Calculate the median:
Calculate the mean:
Determine skewness
Compare the mean and median:
The presence of large values on the right side (\(12, 15, 25\)) pulls the mean to the right, indicating a right-skewed distribution.
Evaluate suitability for a normal curve
A normal curve represents a symmetric, bell-shaped distribution where:
Since this data set is strongly skewed to the right, it cannot be represented by a normal curve.

Snap & solve any problem in the app
Get step-by-step solutions on Sovi AI
Photo-based solutions with guided steps
Explore more problems and detailed explanations
Question 1
No
Question 2
The data set is skewed to the right.