QUESTION IMAGE
Question
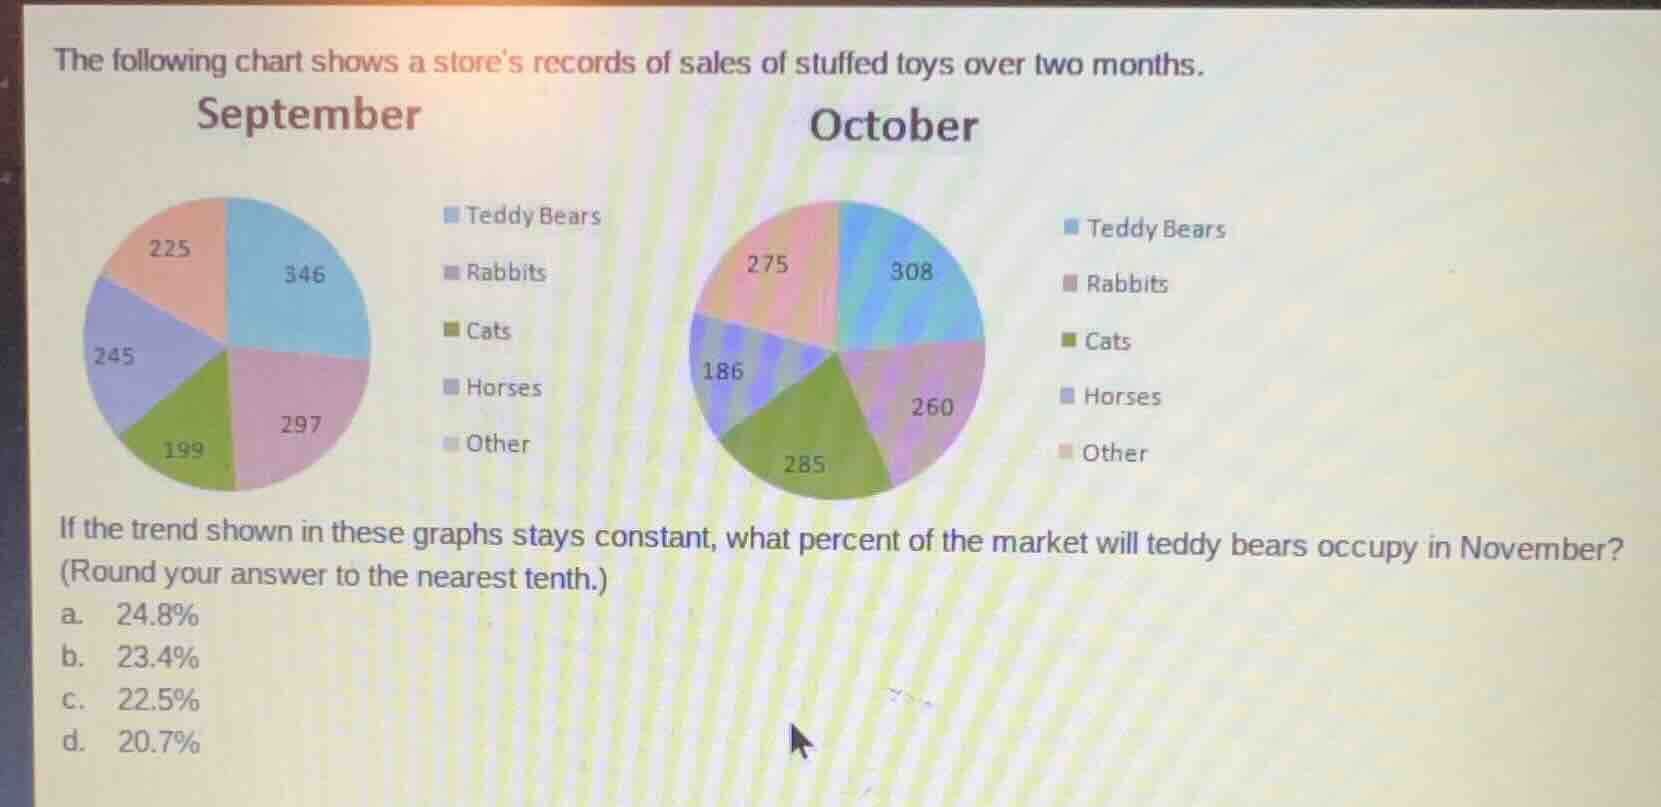
the following chart shows a stores records of sales of stuffed toys over two months.
september
teddy bears: 346
rabbits: 297
cats: 199
horses: 245
other: 225
october
teddy bears: 308
rabbits: 260
cats: 285
horses: 186
other: 275
if the trend shown in these graphs stays constant, what percent of the market will teddy bears occupy in november? (round your answer to the nearest tenth.)
a. 24.8%
b. 23.4%
c. 22.5%
d. 20.7%
Calculate market shares for September
Using the Pie Chart Analysis knowledge point
Calculate market shares for October
Using the Pie Chart Analysis knowledge point
Extrapolate the trend to November
Using the Linear Extrapolation knowledge point
Comparing with the options, \(20.7\%\) is the closest value, which corresponds to a linear change in the percentage share. Let's verify with the exact values:
Let's check if the trend is based on sales volume extrapolation:
Both methods yield approximately \(20.5\%\). Among the choices, \(20.7\%\) (option d) is the closest.

Snap & solve any problem in the app
Get step-by-step solutions on Sovi AI
Photo-based solutions with guided steps
Explore more problems and detailed explanations
- a. 24.8%
- b. 23.4%
- c. 22.5%
- d. 20.7% (Correct answer)