QUESTION IMAGE
Question
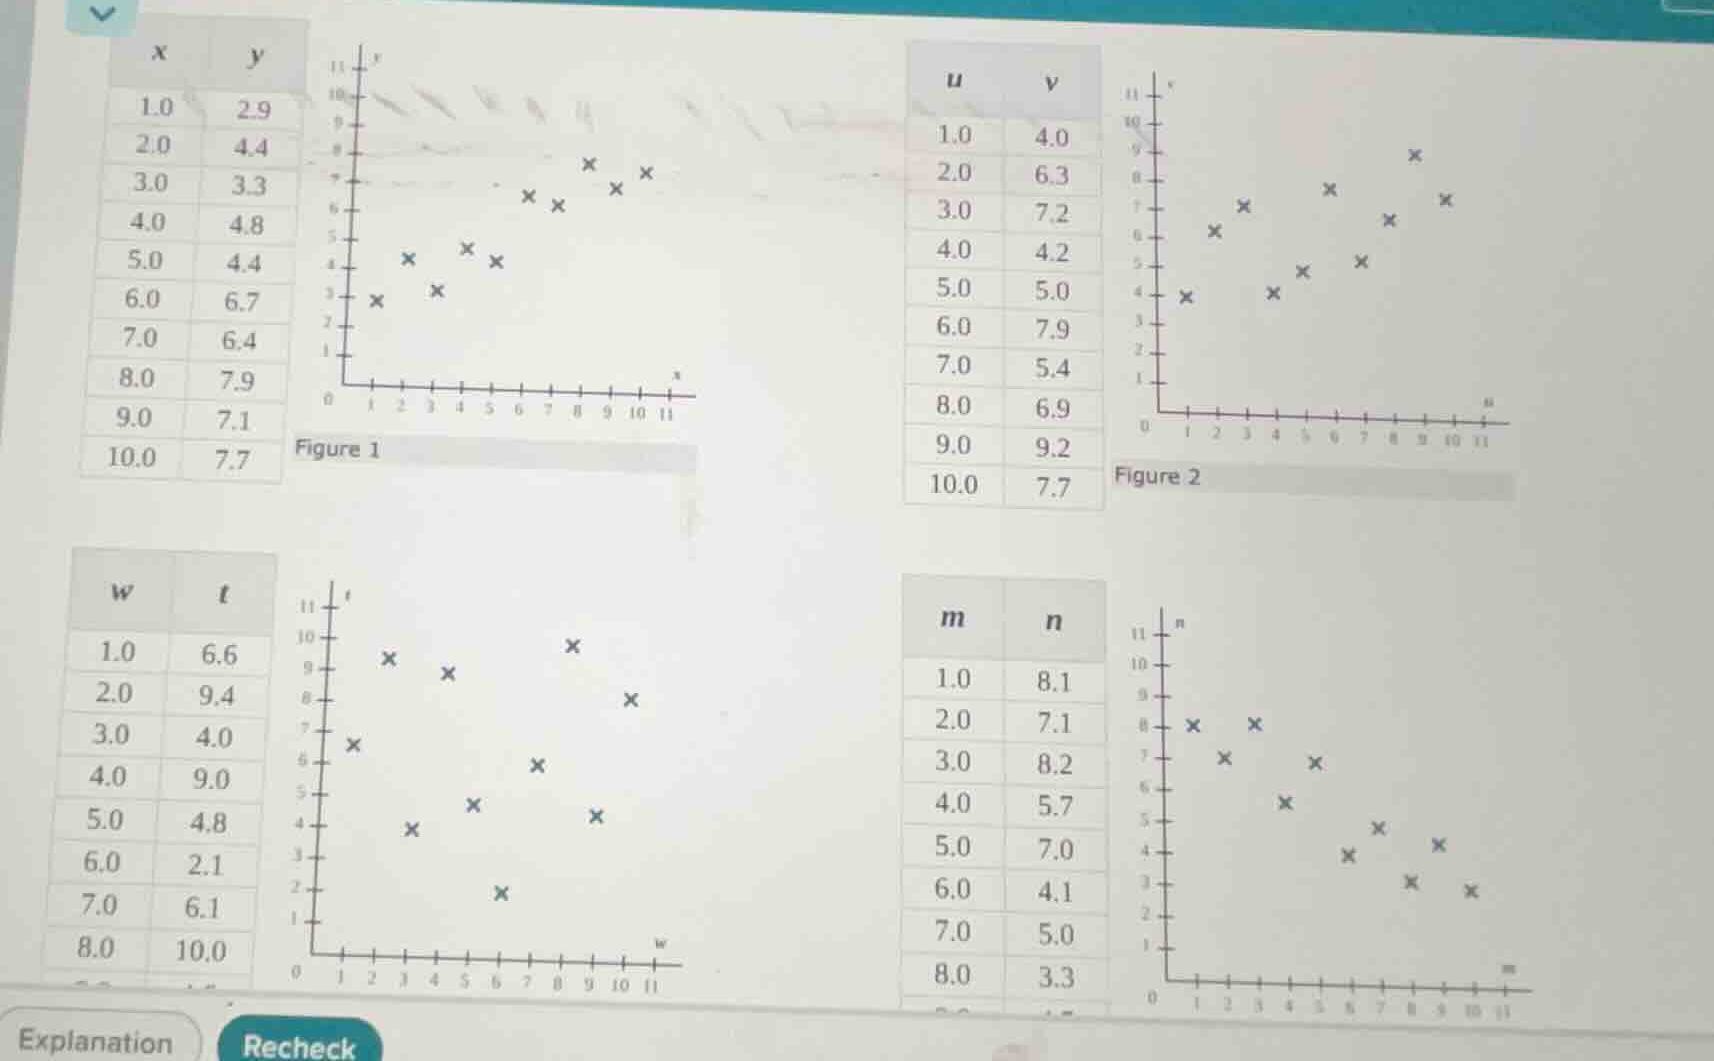
figure 1
figure 2
Identify outliers in Figure 1
Using the Linear Regression knowledge point
The scatter plot in Figure 1 shows a strong positive linear relationship between \(x\) and \(y\), except for one point that lies far away from the general pattern.
Looking at the data table for \(x\) and \(y\):
- For \(x = 1.0\) to \(10.0\), the values of \(y\) increase steadily from \(2.9\) to \(7.7\).
- On the scatter plot, there is an isolated point located at \(x = 11.0, y = 1.0\).
- This point does not follow the linear trend of the rest of the data and is located far horizontally and vertically from the main cluster.
Thus, the outlier in Figure 1 is \((11.0, 1.0)\).
Identify outliers in Figure 2
Using the Linear Regression knowledge point
The scatter plot in Figure 2 shows a positive linear trend between \(u\) and \(v\).
Looking at the data table for \(u\) and \(v\):
- For \(u = 1.0\) to \(10.0\), the values of \(v\) generally increase from \(4.0\) to \(7.7\), with a peak at \(9.2\) when \(u = 9.0\).
- On the scatter plot, there is a point that lies significantly above the linear trend line formed by the other points. This point is located at \(u = 3.0, v = 7.2\).
- Another point at \(u = 4.0, v = 4.2\) lies slightly below the trend, but the most prominent outlier deviating vertically from the regression line is at \(u = 3.0, v = 7.2\).
Thus, the outlier in Figure 2 is \((3.0, 7.2)\).
Identify outliers in Figure 3
Using the Linear Regression knowledge point
The scatter plot in Figure 3 (variables \(w\) and \(t\)) shows points scattered widely with no clear linear relationship.
Looking at the data table for \(w\) and \(t\):
- The points are highly dispersed: \((1.0, 6.6)\), \((2.0, 9.4)\), \((3.0, 4.0)\), \((4.0, 9.0)\), \((5.0, 4.8)\), \((6.0, 2.1)\), \((7.0, 6.1)\), \((8.0, 10.0)\).
- On the plot, there is a point plotted far to the right at \(w = 11.0, t = 1.0\).
- This point is an outlier in the horizontal direction (an influential point/leverage point) relative to the rest of the data which only goes up to \(w = 8.0\).
Thus, the outlier in Figure 3 is \((11.0, 1.0)\).
Identify outliers in Figure 4
Using the Linear Regression knowledge point
The scatter plot in Figure 4 (variables \(m\) and \(n\)) shows a clear negative linear relationship.
Looking at the data table for \(m\) and \(n\):
- For \(m = 1.0\) to \(8.0\), the values of \(n\) generally decrease from \(8.1\) to \(3.3\).
- On the scatter plot, there is a point that lies significantly below the negative linear trend. This point is located at \(m = 4.0, n = 5.7\).
- Comparing it to the trend line, at \(m = 4.0\), the expected value is around \(6.5\), making \((4.0, 5.7)\) deviate vertically.
Thus, the outlier in Figure 4 is \((4.0, 5.7)\).

Snap & solve any problem in the app
Get step-by-step solutions on Sovi AI
Photo-based solutions with guided steps
Explore more problems and detailed explanations
| Figure | Outlier Coordinate \((x, y)\) |
|---|---|
| Figure 2 | \((3.0, 7.2)\) |
| Figure 3 | \((11.0, 1.0)\) |
| Figure 4 | \((4.0, 5.7)\) |