QUESTION IMAGE
Question
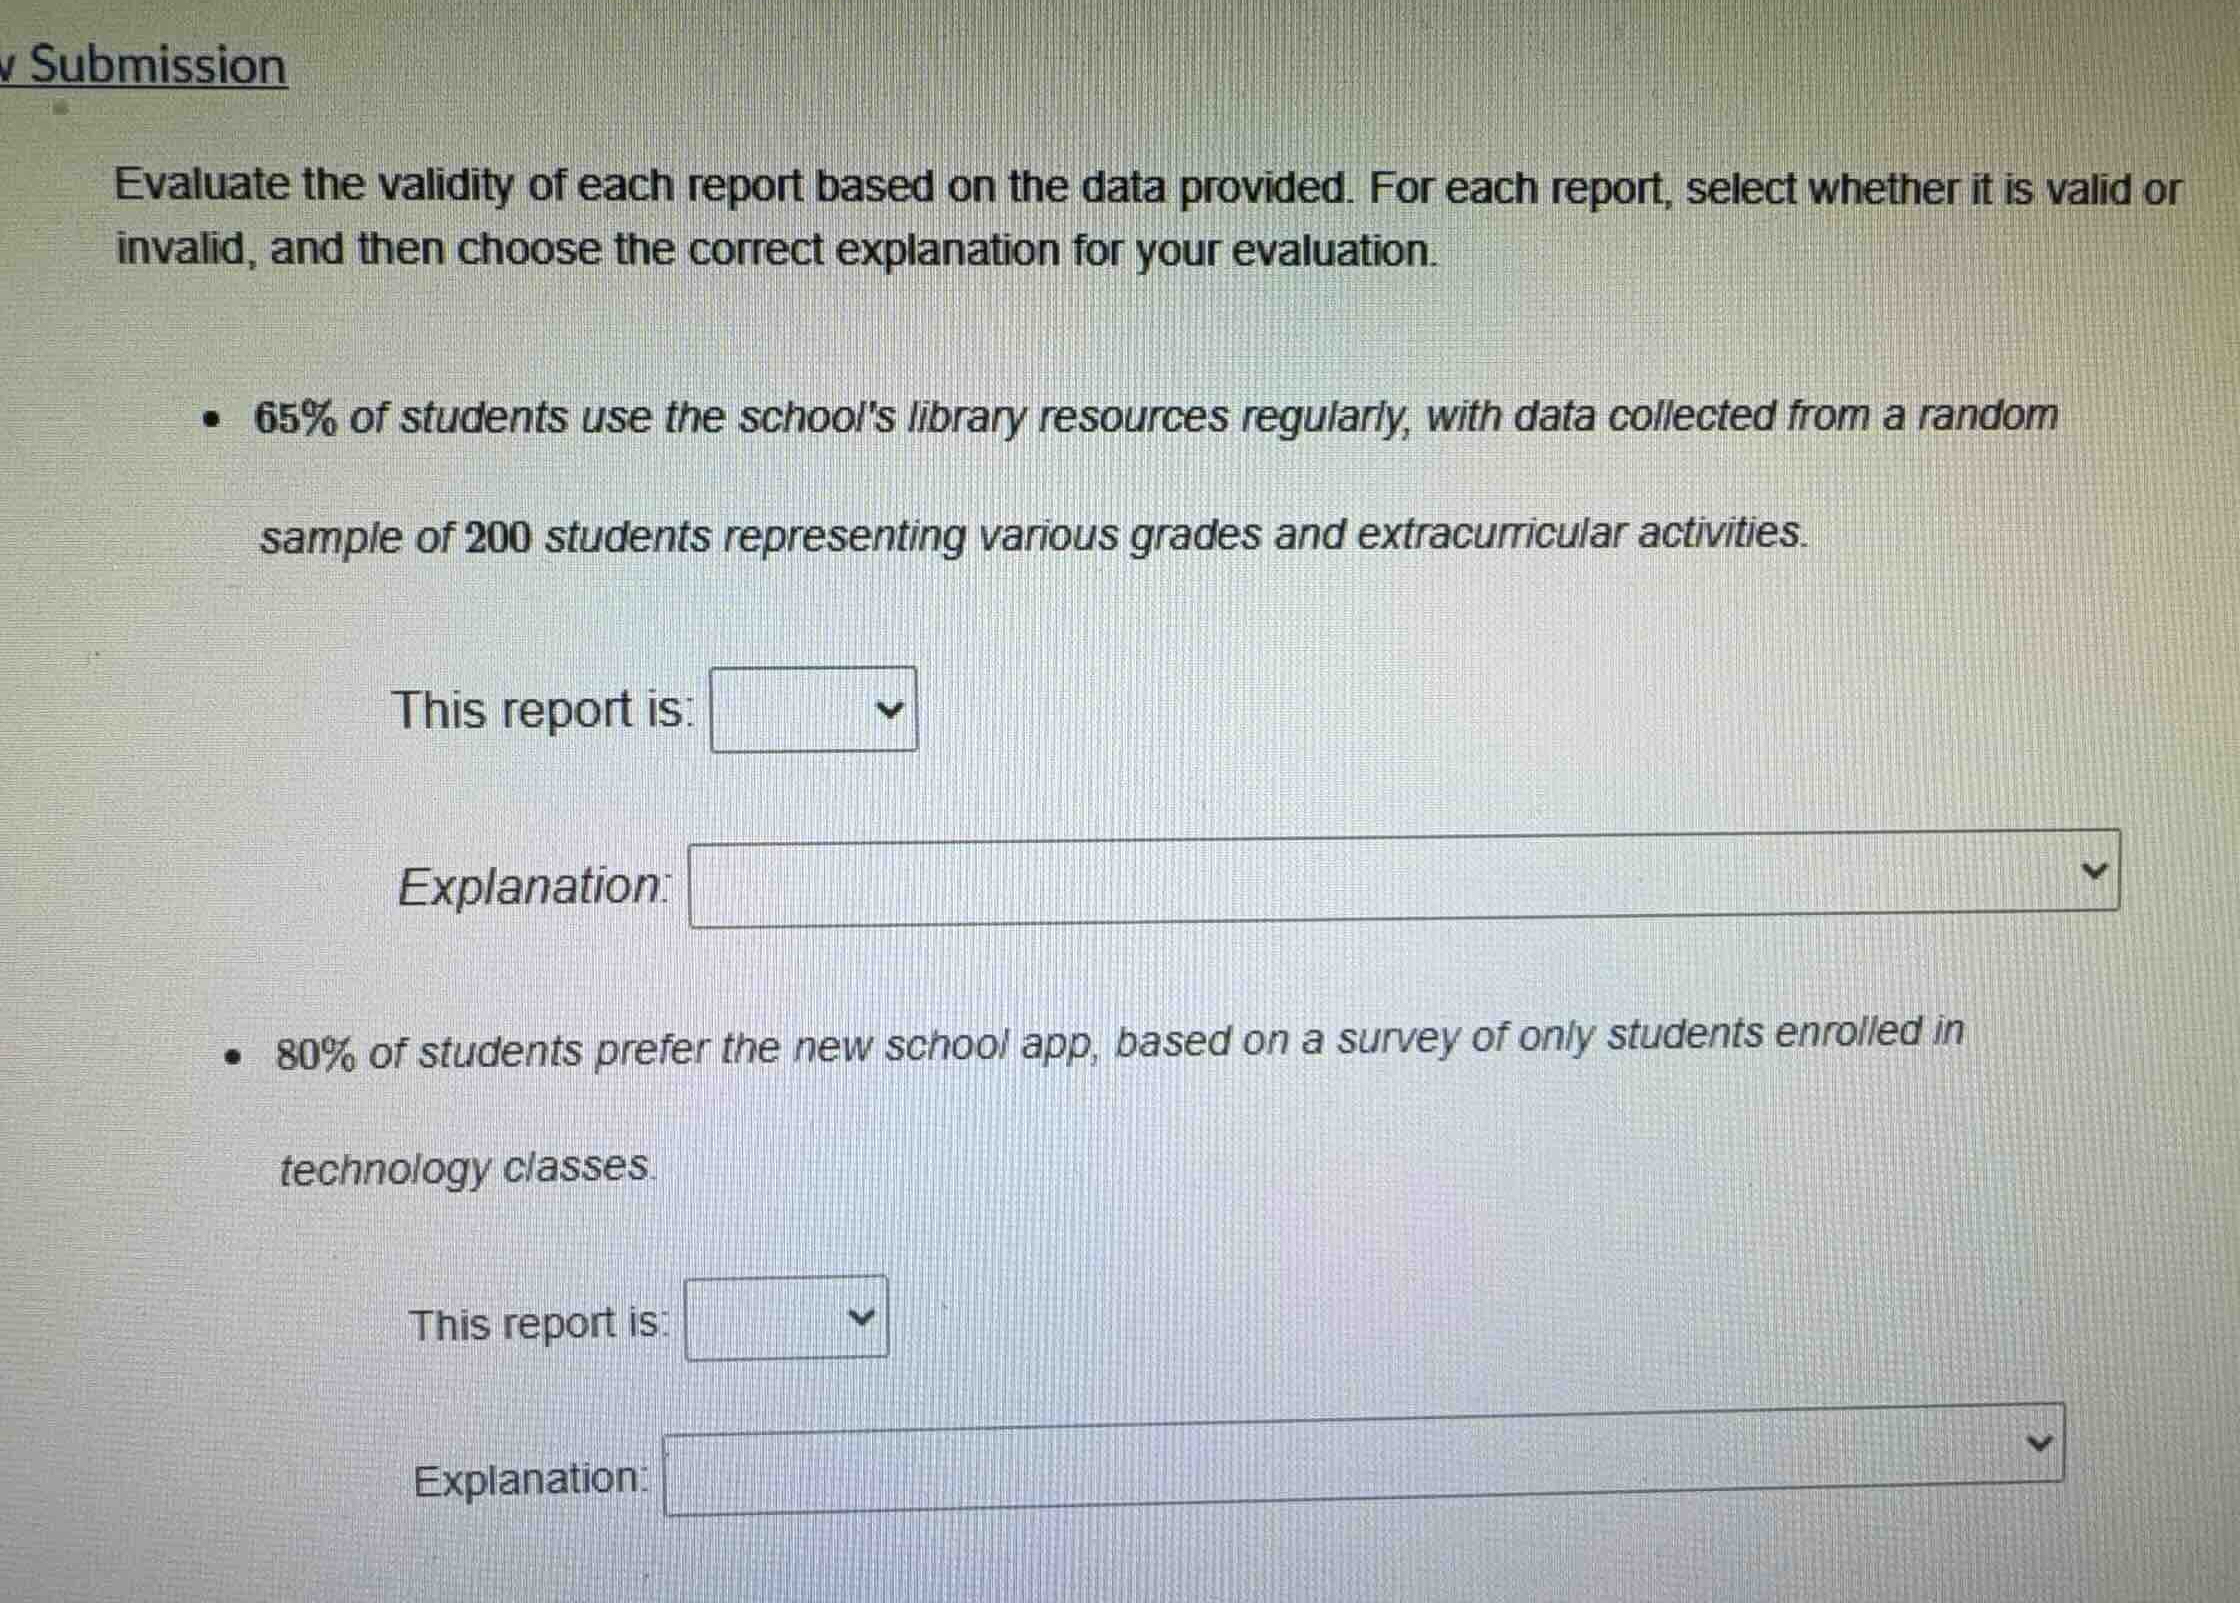
evaluate the validity of each report based on the data provided. for each report, select whether it is valid or invalid, and then choose the correct explanation for your evaluation.
- 65% of students use the schools library resources regularly, with data collected from a random sample of 200 students representing various grades and extracurricular activities.
this report is: select
explanation: select
- 80% of students prefer the new school app, based on a survey of only students enrolled in technology classes.
this report is: select
explanation: select
Analyze the first report
Using the Representative Sample knowledge point.
The first report uses a random sample of 200 students representing various grades and extracurricular activities.
Because the sample is random and diverse, it is representative of the student population.
Therefore, this report is valid.
Analyze the second report
Using the Sampling Bias knowledge point.
The second report surveys only students enrolled in technology classes to draw a conclusion about all students.
Students in technology classes are more likely to prefer a new school app than the general student body.
Because the sample is not representative, this report is invalid due to sampling bias.

Snap & solve any problem in the app
Get step-by-step solutions on Sovi AI
Photo-based solutions with guided steps
Explore more problems and detailed explanations
Question 1
- This report is: Valid
- Explanation: The data was collected from a random sample that represents various grades and extracurricular activities, making it representative of the entire student population.
Question 2
- This report is: Invalid
- Explanation: The survey only included students enrolled in technology classes, which introduces sampling bias and does not represent the preferences of the entire student body.