QUESTION IMAGE
Question
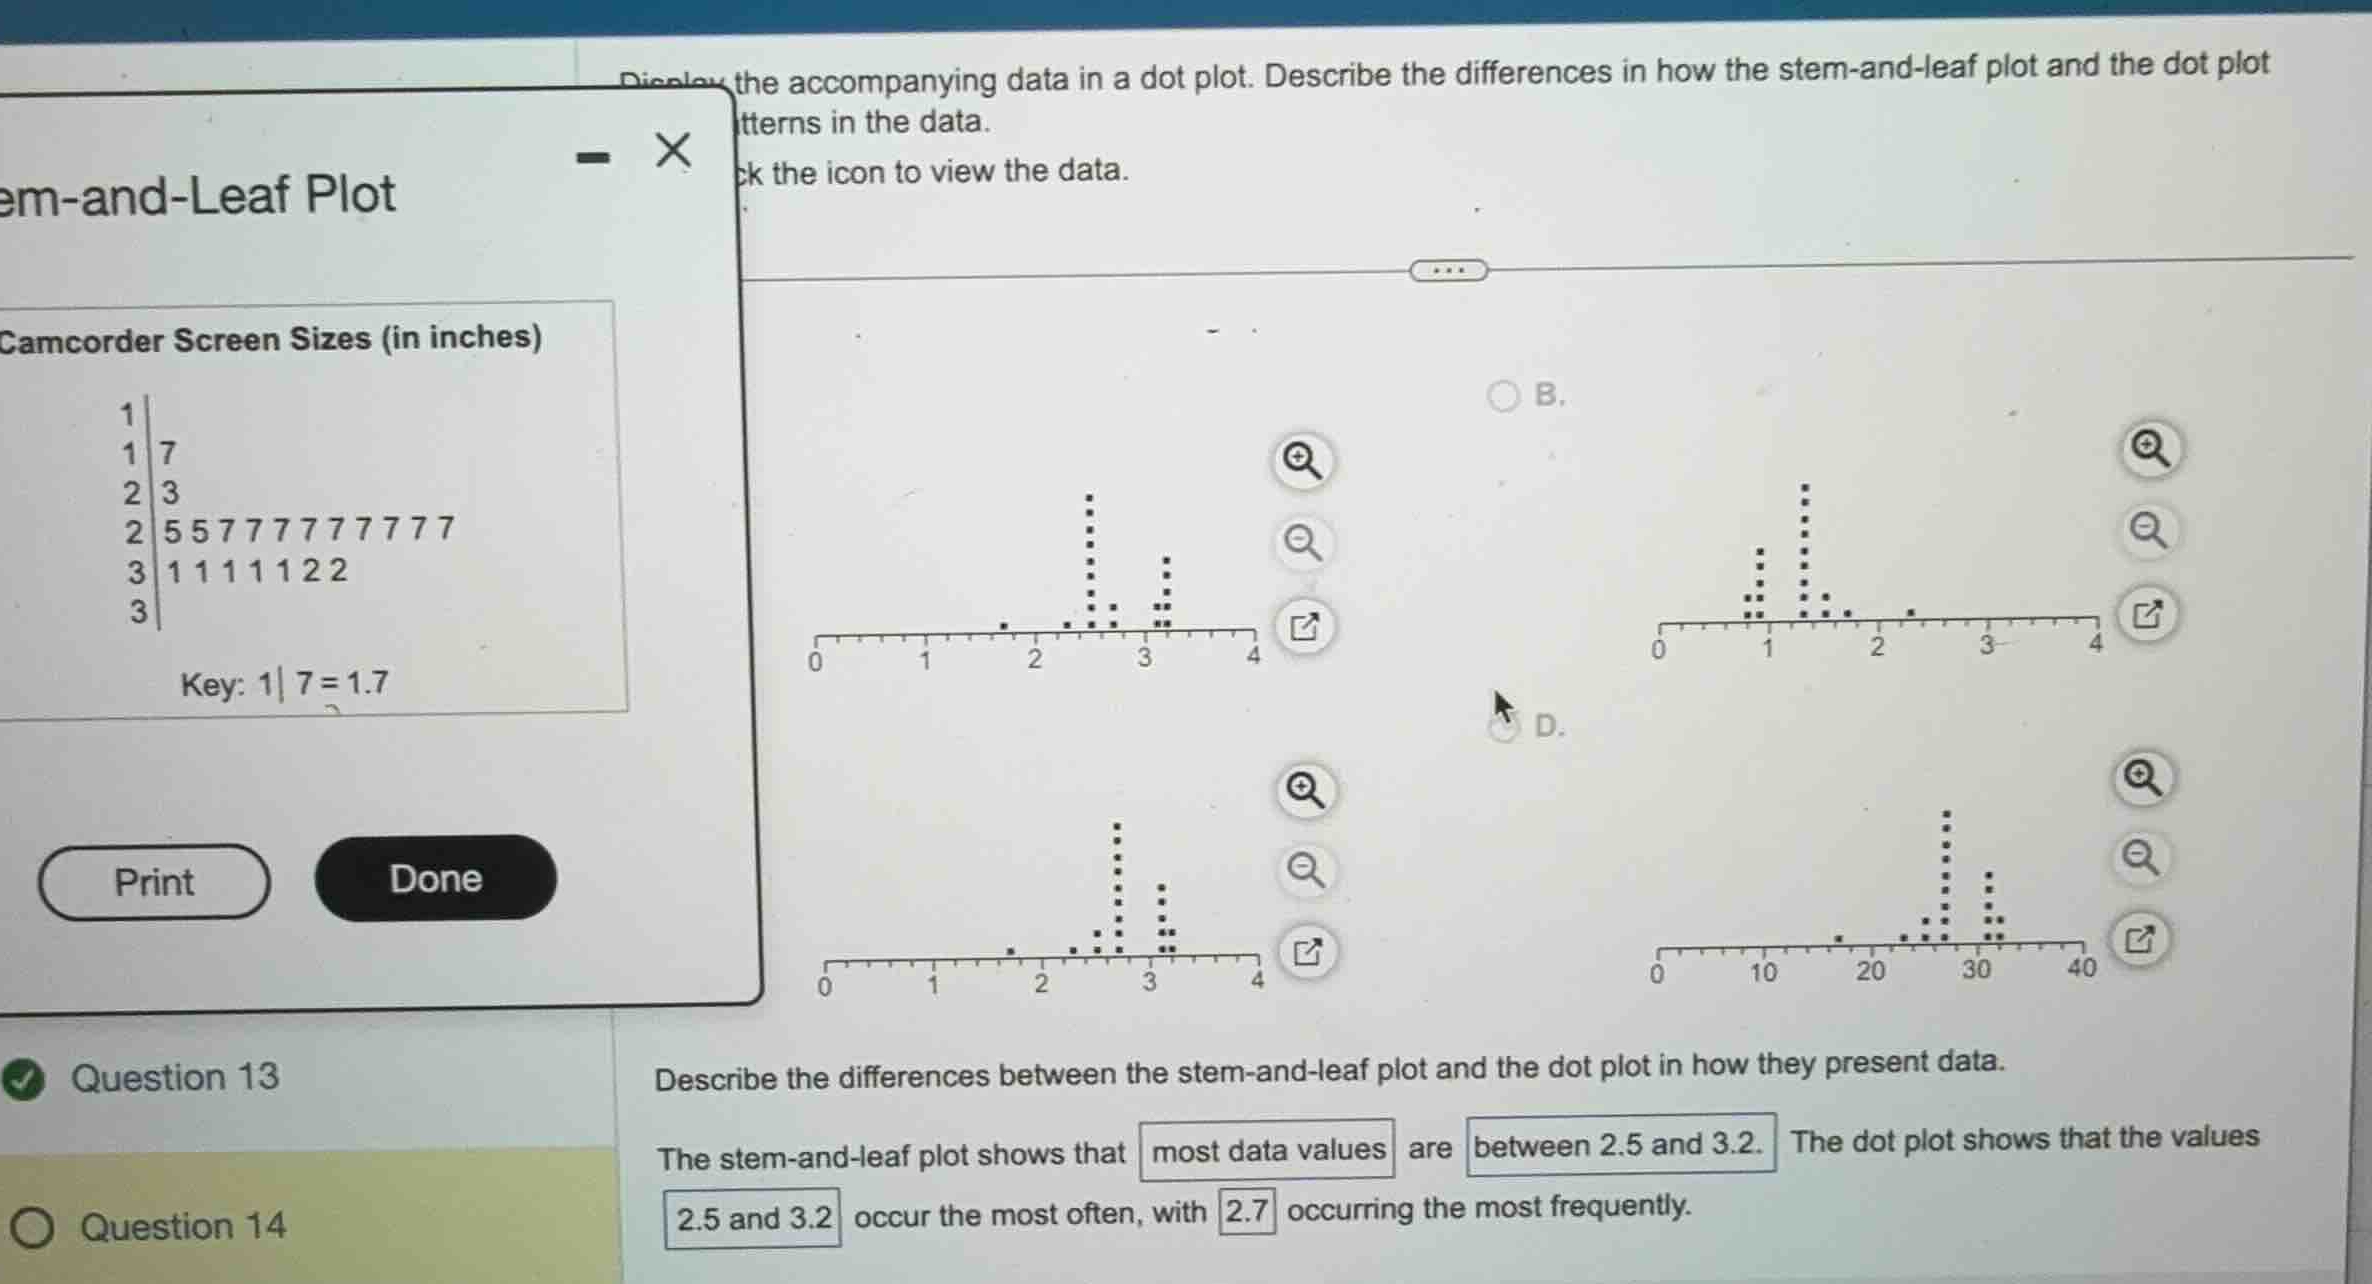
display the accompanying data in a dot plot. describe the differences in how the stem-and-leaf plot and the dot plot show patterns in the data.
camcorder screen sizes (in inches)
1 |
1 | 7
2 | 3
2 | 5 5 7 7 7 7 7 7 7 7 7
3 | 1 1 1 1 1 2 2
3 |
key: 1 | 7 = 1.7
describe the differences between the stem-and-leaf plot and the dot plot in how they present data.
the stem-and-leaf plot shows that most data values are between 2.5 and 3.2. the dot plot shows that the values 2.5 and 3.2 occur the most often, with 2.7 occurring the most frequently.
Identify the data values from the stem-and-leaf plot
Match the data to the correct dot plot
Determine the correct dropdown options for the description

Snap & solve any problem in the app
Get step-by-step solutions on Sovi AI
Photo-based solutions with guided steps
Explore more problems and detailed explanations
Question 13
- (A) Dot plot with a peak of 10 dots at 2.7, 5 dots at 3.1, 2 dots at 2.5 and 3.2, and single dots at 1.7 and 2.3 on a scale of 0 to 4. (Correct answer)
- (B) Dot plot with data clustered around 1.0 to 1.5.
- (C) Dot plot with data clustered around 25 to 32 on a scale of 0 to 40.
- (D) Dot plot with a peak of 10 dots at 2.7, but incorrect distribution at other values.
Question 14
The stem-and-leaf plot shows that <blank>most data values</blank> are <blank>between 2.5 and 3.2</blank>. The dot plot shows that the values <blank>2.5 and 3.2</blank> occur the most often, with <blank>2.7</blank> occurring the most frequently.