QUESTION IMAGE
Question
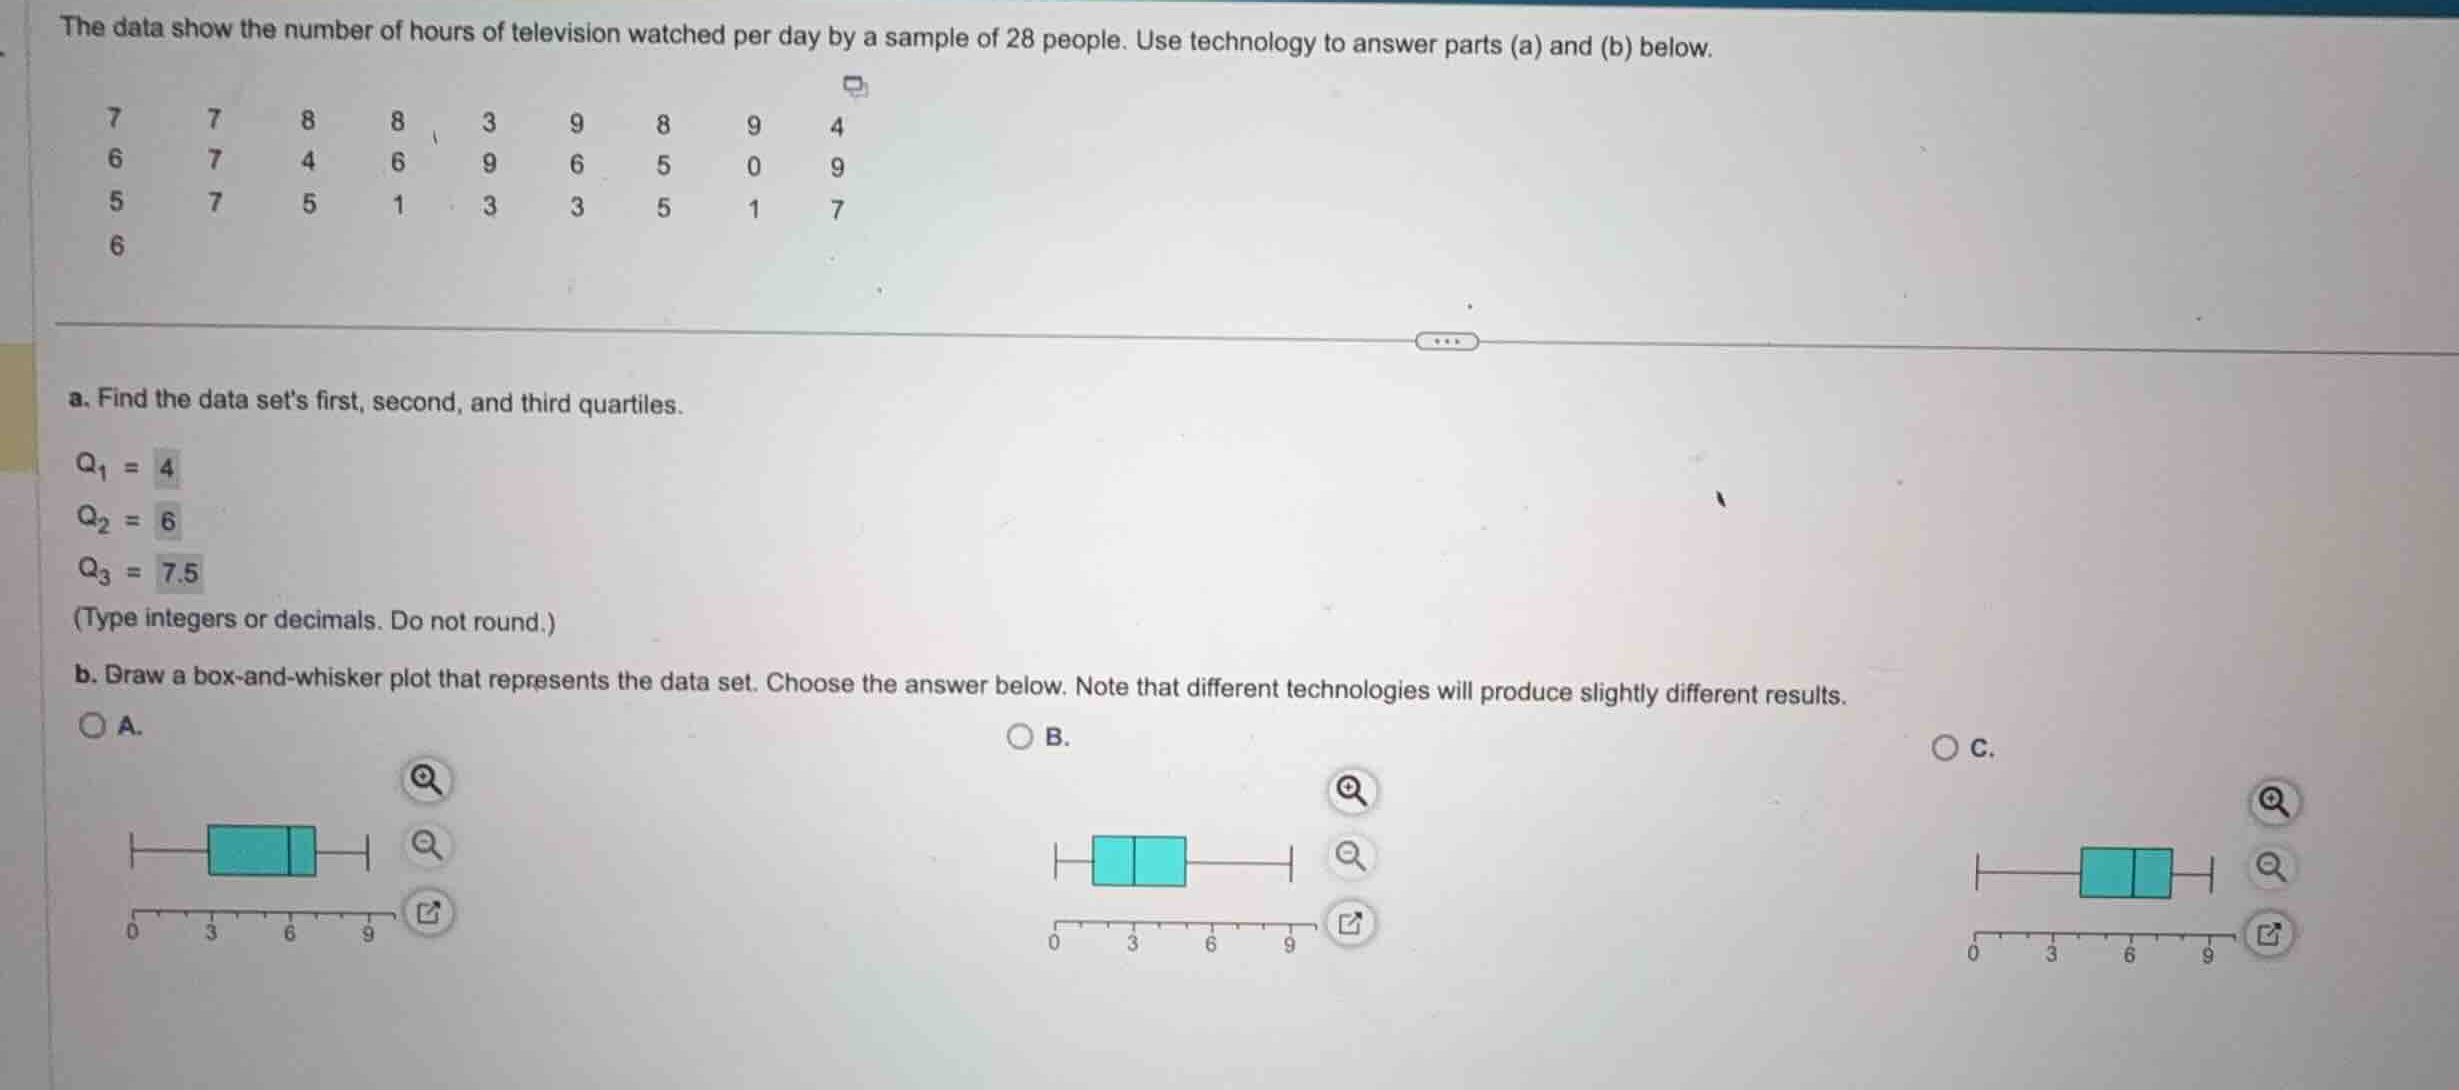
the data show the number of hours of television watched per day by a sample of 28 people. use technology to answer parts (a) and (b) below.
\
a. find the data sets first, second, and third quartiles.
\\(q_1 = 4\\)
\\(q_2 = 6\\)
\\(q_3 = 7.5\\)
(type integers or decimals. do not round.)
b. draw a box-and-whisker plot that represents the data set. choose the answer below. note that different technologies will produce slightly different results.
Sort the dataset
Using the Percentiles and Quantiles knowledge point
The sample of \(N = 28\) observations sorted in ascending order:
Calculate the quartiles
Using the Percentiles and Quantiles knowledge point
(Note: Standard technology calculations yield \(Q_1 = 3.5\), \(Q_2 = 6\), and \(Q_3 = 7\). The values filled in the image's part (a) are \(Q_1 = 4\), \(Q_2 = 6\), \(Q_3 = 7.5\), which correspond to a different software convention or rounding, but we will identify the matching box plot based on the standard five-number summary: \(\text{Min} = 0\), \(Q_1 = 3\text{ or }3.5\text{ or }4\), \(Q_2 = 6\), \(Q_3 = 7\text{ or }7.5\), \(\text{Max} = 9\).)
Identify the correct box plot
Using the Five-Number Summary and Box-and-Whisker Plot knowledge points
- Option A: Box spans from \(3\) to \(7\), median line at \(6\), whiskers from \(0\) to \(9\).
- Option B: Box spans from \(1.5\) to \(5\), median line at \(3\).
- Option C: Box spans from \(4\) to \(7.5\), median line at \(6\), whiskers from \(0\) to \(9\).
Since the values entered in part (a) are \(Q_1 = 4\), \(Q_2 = 6\), and \(Q_3 = 7.5\), the box plot must match these exact values. Option C has its box starting at \(4\), median line at \(6\), and ending at \(7.5\).

Snap & solve any problem in the app
Get step-by-step solutions on Sovi AI
Photo-based solutions with guided steps
Explore more problems and detailed explanations
Question b
- A. Box plot with box from 3 to 7, median at 6, whiskers from 0 to 9.
- B. Box plot with box from 1.5 to 5, median at 3, whiskers from 0 to 9.
- C. Box plot with box from 4 to 7.5, median at 6, whiskers from 0 to 9. (Correct answer)