QUESTION IMAGE
Question
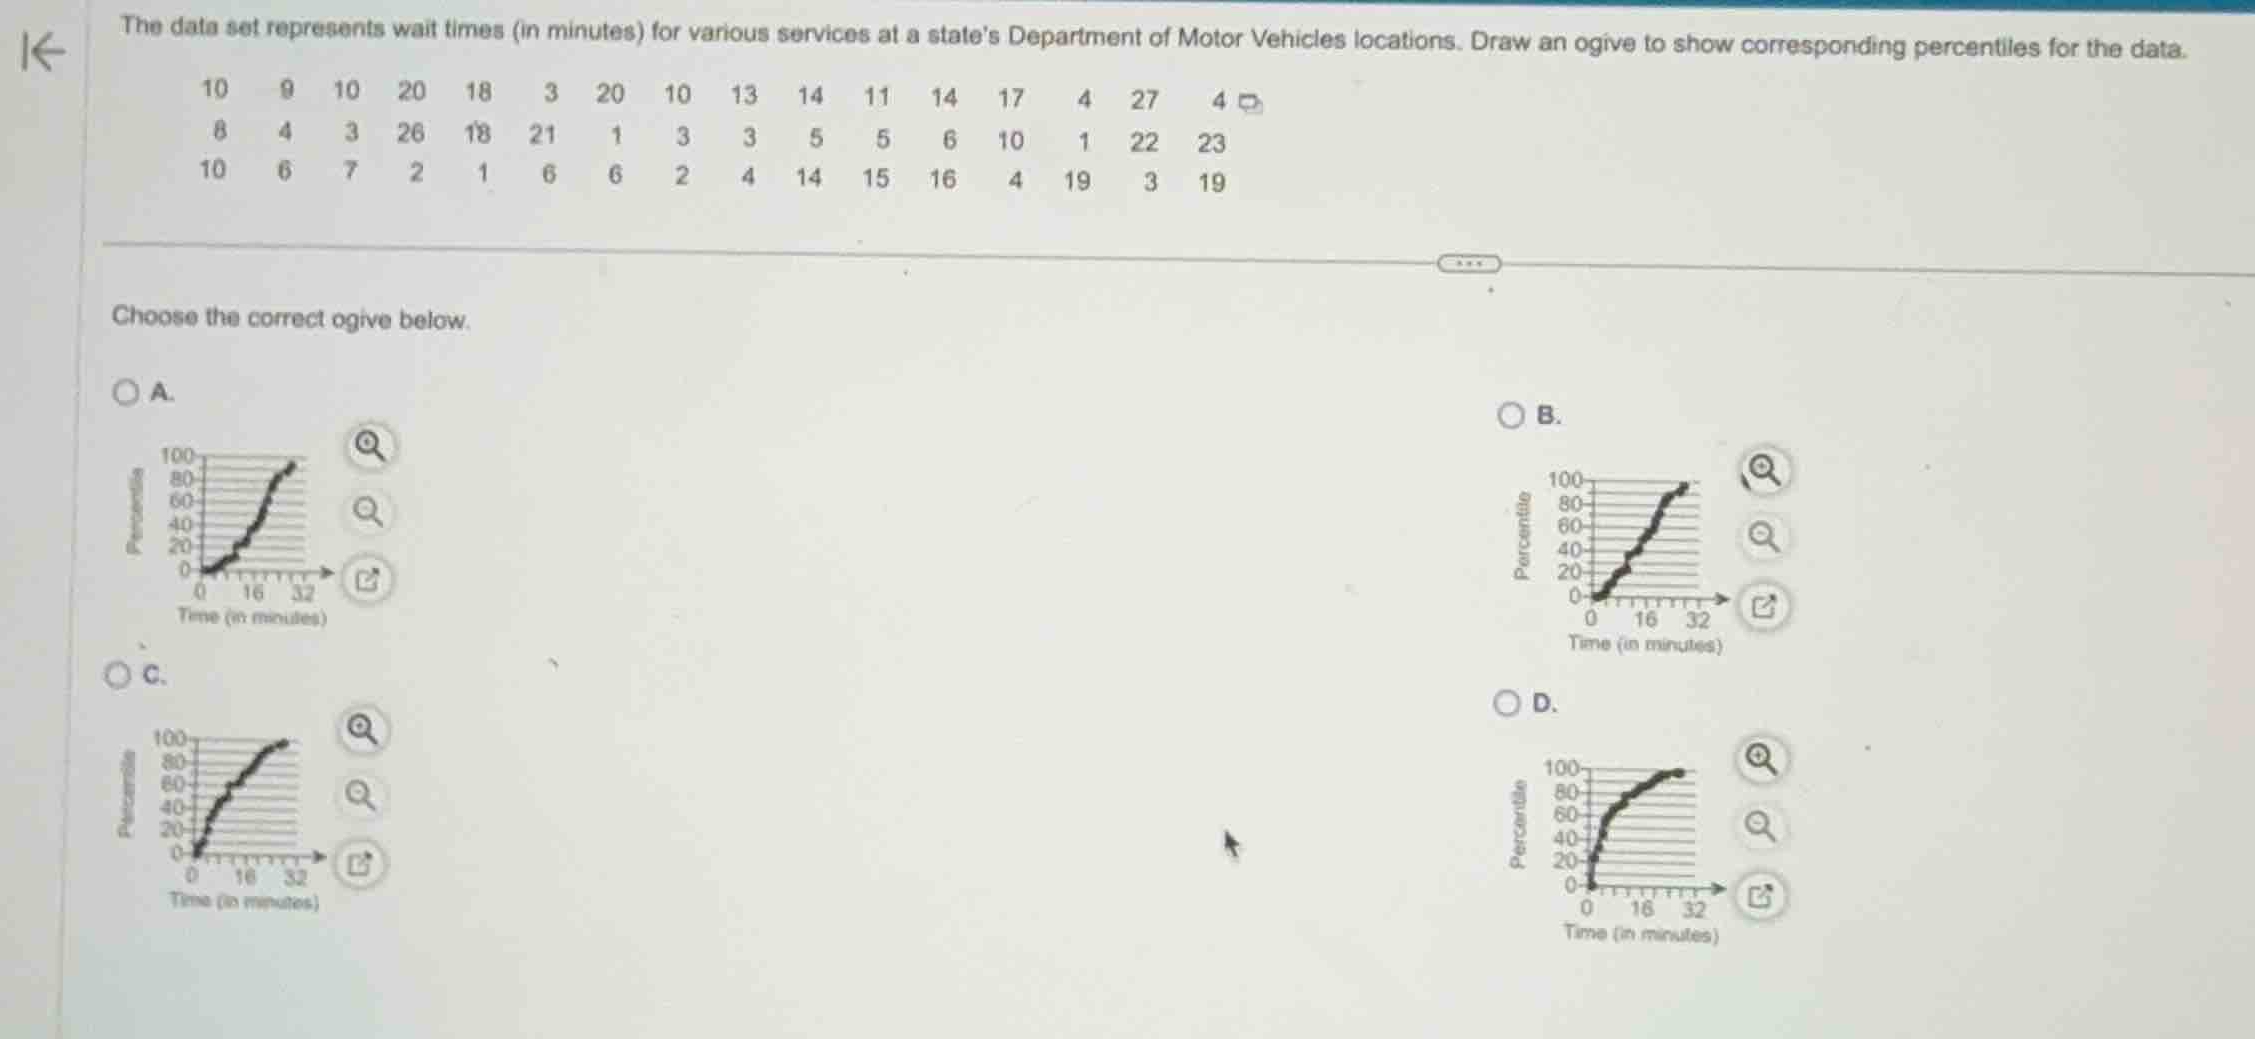
the data set represents wait times (in minutes) for various services at a states department of motor vehicles locations. draw an ogive to show corresponding percentiles for the data.
\
choose the correct ogive below.
Analyze the dataset
Using the Ogive Construction and Percentiles and Quantiles knowledge points
We first count the total number of data points \(N\) and sort them to find key percentiles.
The dataset contains 45 values:
Row 1: 10, 9, 10, 20, 18, 3, 20, 10, 13, 14, 11, 14, 17, 4, 27, 4
Row 2: 8, 4, 3, 26, 18, 21, 1, 3, 3, 5, 5, 6, 10, 1, 22, 23
Row 3: 10, 6, 7, 2, 1, 6, 6, 2, 4, 14, 15, 16, 4, 19, 3, 19
Let's count the frequency of each value:
- 1: 3 times
- 2: 2 times
- 3: 5 times
- 4: 5 times
- 5: 2 times
- 6: 4 times
- 7: 1 time
- 8: 1 time
- 9: 1 time
- 10: 5 times
- 11: 1 time
- 13: 1 time
- 14: 3 times
- 15: 1 time
- 16: 1 time
- 17: 1 time
- 18: 2 times
- 19: 2 times
- 20: 2 times
- 21: 1 time
- 22: 1 time
- 23: 1 time
- 26: 1 time
- 27: 1 time
Total count \(N = 3 + 2 + 5 + 5 + 2 + 4 + 1 + 1 + 1 + 5 + 1 + 1 + 3 + 1 + 1 + 1 + 2 + 2 + 2 + 1 + 1 + 1 + 1 + 1 = 45\).
Calculate cumulative percentiles
Using the Ogive Construction and Percentiles and Quantiles knowledge points
An ogive plots cumulative percentiles against the upper class boundaries or data values. Let's find the cumulative percentage of values less than or equal to specific times:
- For \(x = 0\): Cumulative frequency = 0, Percentile = 0%
- For \(x = 4\): Values \(\le 4\) are 1 (3), 2 (2), 3 (5), 4 (5). Total = 15.
Percentile = \(\frac{15}{45} \times 100\% = 33.3\%\)
- For \(x = 10\): Values \(\le 10\) are 15 (from \(\le 4\)) + 5 (2), 6 (4), 7 (1), 8 (1), 9 (1), 10 (5) = 15 + 14 = 29.
Percentile = \(\frac{29}{45} \times 100\% \approx 64.4\%\)
- For \(x = 16\): Values \(\le 16\) are 29 (from \(\le 10\)) + 11 (1), 13 (1), 14 (3), 15 (1), 16 (1) = 29 + 7 = 36.
Percentile = \(\frac{36}{45} \times 100\% = 80\%\)
- For \(x = 20\): Values \(\le 20\) are 36 (from \(\le 16\)) + 17 (1), 18 (2), 19 (2), 20 (2) = 36 + 7 = 43.
Percentile = \(\frac{43}{45} \times 100\% \approx 95.6\%\)
Compare with the given options
Using the Ogive Construction knowledge point
Let's check the coordinates \((x, y)\) where \(x\) is Time and \(y\) is Percentile:
- At \(x = 16\), the percentile must be exactly \(80\%\).
- Looking at Option A: At \(x = 16\), the curve is at approximately \(40\%\). This is incorrect.
- Looking at Option B: At \(x = 16\), the curve is at approximately \(50\%\). This is incorrect.
- Looking at Option C: At \(x = 16\), the curve is at approximately \(80\%\). At \(x = 10\), it is around \(64\%\). At \(x = 4\), it is around \(33\%\). This matches our calculations perfectly.
- Looking at Option D: At \(x = 16\), the curve is already near \(90\%\), and it rises too steeply at the beginning. This is incorrect.
Therefore, Option C is the correct ogive.

Snap & solve any problem in the app
Get step-by-step solutions on Sovi AI
Photo-based solutions with guided steps
Explore more problems and detailed explanations
- (A) Ogive showing percentile around 40% at 16 minutes
- (B) Ogive showing percentile around 50% at 16 minutes
- (C) Ogive showing percentile around 80% at 16 minutes (Correct answer)
- (D) Ogive showing percentile around 90% at 16 minutes