QUESTION IMAGE
Question
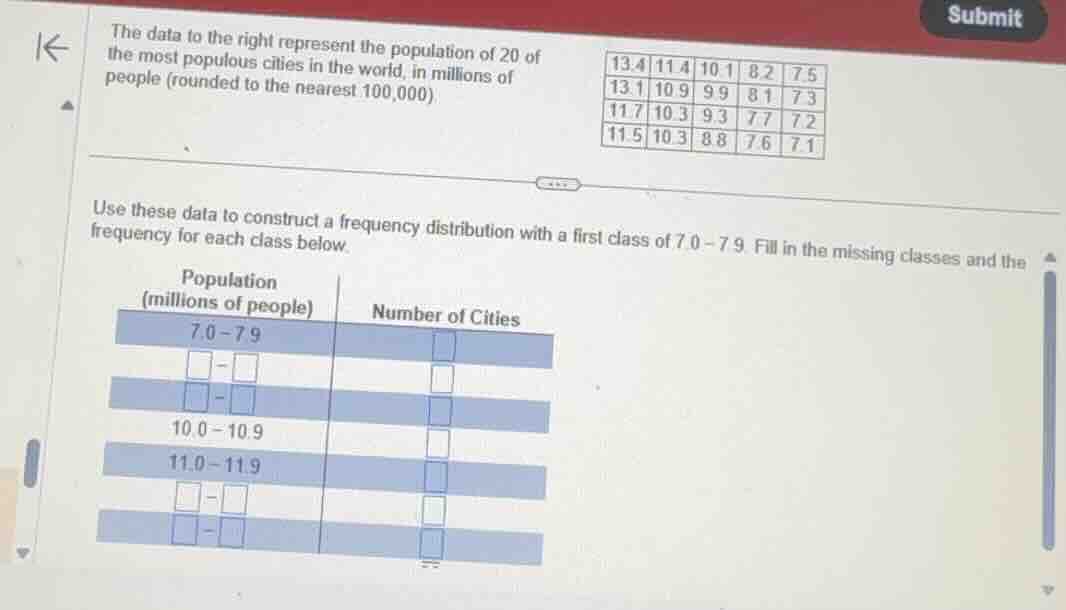
the data to the right represent the population of 20 of the most populous cities in the world, in millions of people (rounded to the nearest 100,000).
use these data to construct a frequency distribution with a first class of \\(7.0 - 7.9\\). fill in the missing classes and the frequency for each class below.
population (millions of people) | number of cities
\\(7.0 - 7.9\\) |
- |
- |
\\(10.0 - 10.9\\) |
\\(11.0 - 11.9\\) |
- |
- |
⚡ Using what you learned: Organizing Data in Tables
Step 1: Determine the Class Intervals
The first class is given as \(7.0 - 7.9\). The class width is:
\[
8.0 - 7.0 = 1.0
\]
Using this uniform class width of \(1.0\), we fill in the missing classes sequentially from the lowest value (\(7.0\)) to the highest value in the dataset (\(13.4\)):
- \(7.0 - 7.9\)
- \(8.0 - 8.9\)
- \(9.0 - 9.9\)
- \(10.0 - 10.9\)
- \(11.0 - 11.9\)
- \(12.0 - 12.9\)
- \(13.0 - 13.9\)
---
Step 2: Count the Frequencies for Each Class
We count how many data points fall into each interval from the provided dataset:
\[
\{13.4, 13.1, 11.7, 11.5, 11.4, 10.9, 10.3, 10.3, 10.1, 9.9, 9.3, 8.8, 8.2, 8.1, 7.7, 7.6, 7.5, 7.3, 7.2, 7.1\}
\]
- \(7.0 - 7.9\): \(7.7, 7.6, 7.5, 7.3, 7.2, 7.1\) \(
ightarrow\) 6 cities
- \(8.0 - 8.9\): \(8.2, 8.1, 8.8\) \(
ightarrow\) 3 cities
- \(9.0 - 9.9\): \(9.9, 9.3\) \(
ightarrow\) 2 cities
- \(10.0 - 10.9\): \(10.9, 10.3, 10.3, 10.1\) \(
ightarrow\) 4 cities
- \(11.0 - 11.9\): \(11.7, 11.5, 11.4\) \(
ightarrow\) 3 cities
- \(12.0 - 12.9\): None \(
ightarrow\) 0 cities
- \(13.0 - 13.9\): \(13.4, 13.1\) \(
ightarrow\) 2 cities
---

Snap & solve any problem in the app
Get step-by-step solutions on Sovi AI
Photo-based solutions with guided steps
Explore more problems and detailed explanations
| Population (millions of people) | Number of Cities |
|---|---|
| \(8.0 - 8.9\) | 3 |
| \(9.0 - 9.9\) | 2 |
| \(10.0 - 10.9\) | 4 |
| \(11.0 - 11.9\) | 3 |
| \(12.0 - 12.9\) | 0 |
| \(13.0 - 13.9\) | 2 |