QUESTION IMAGE
Question
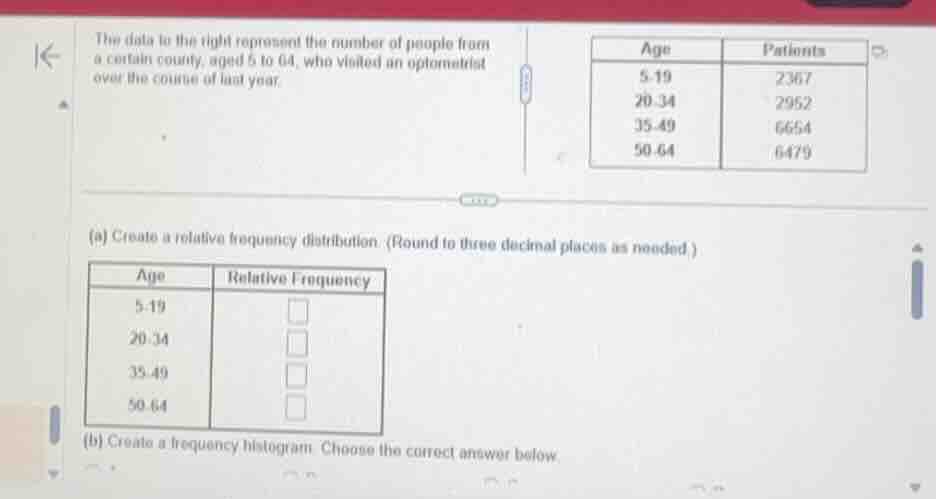
the data to the right represent the number of people from a certain county, aged 5 to 64, who visited an optometrist over the course of last year.
(a) create a relative frequency distribution. (round to three decimal places as needed.)
(b) create a frequency histogram. choose the correct answer below.
🆕 New Concept Discovered: Relative Frequency Distribution
Proportion of data falling in each class
Step 1: Find the total number of patients
To find the relative frequency for each age group, we first need to calculate the total number of patients across all groups by summing the frequencies.
\[
\text{Total} = 2367 + 2952 + 6654 + 6479 = 18452
\]
Step 2: Calculate the relative frequency for each class
The relative frequency of a class is calculated by dividing the frequency of that class by the total number of observations:
\[
\text{Relative Frequency} = \frac{\text{Class Frequency}}{\text{Total Frequency}}
\]
We will round each result to three decimal places.
- For Age 5–19:
\[
\frac{2367}{18452} \approx 0.12827
ightarrow 0.128
\]
- For Age 20–34:
\[
\frac{2952}{18452} \approx 0.15998
ightarrow 0.160
\]
- For Age 35–49:
\[
\frac{6654}{18452} \approx 0.36061
ightarrow 0.361
\]
- For Age 50–64:
\[
\frac{6479}{18452} \approx 0.35112
ightarrow 0.351
\]

Snap & solve any problem in the app
Get step-by-step solutions on Sovi AI
Photo-based solutions with guided steps
Explore more problems and detailed explanations
The completed relative frequency table is:
| Age | Relative Frequency |
|---|---|
| 20–34 | 0.160 |
| 35–49 | 0.361 |
| 50–64 | 0.351 |