QUESTION IMAGE
Question
construct a pie chart for the percentages of mothers aged 40 to 44 in a certain country with various numbers of children.
\
$$\begin{tabular}{|c|c|}
\\hline
number of children & percentage of mothers \\\\
\\hline
1 & 20\\% \\\\
2 & 40\\% \\\\
3 & 26\\% \\\\
4 or more & 14\\% \\\\
\\hline
\\end{tabular}$$
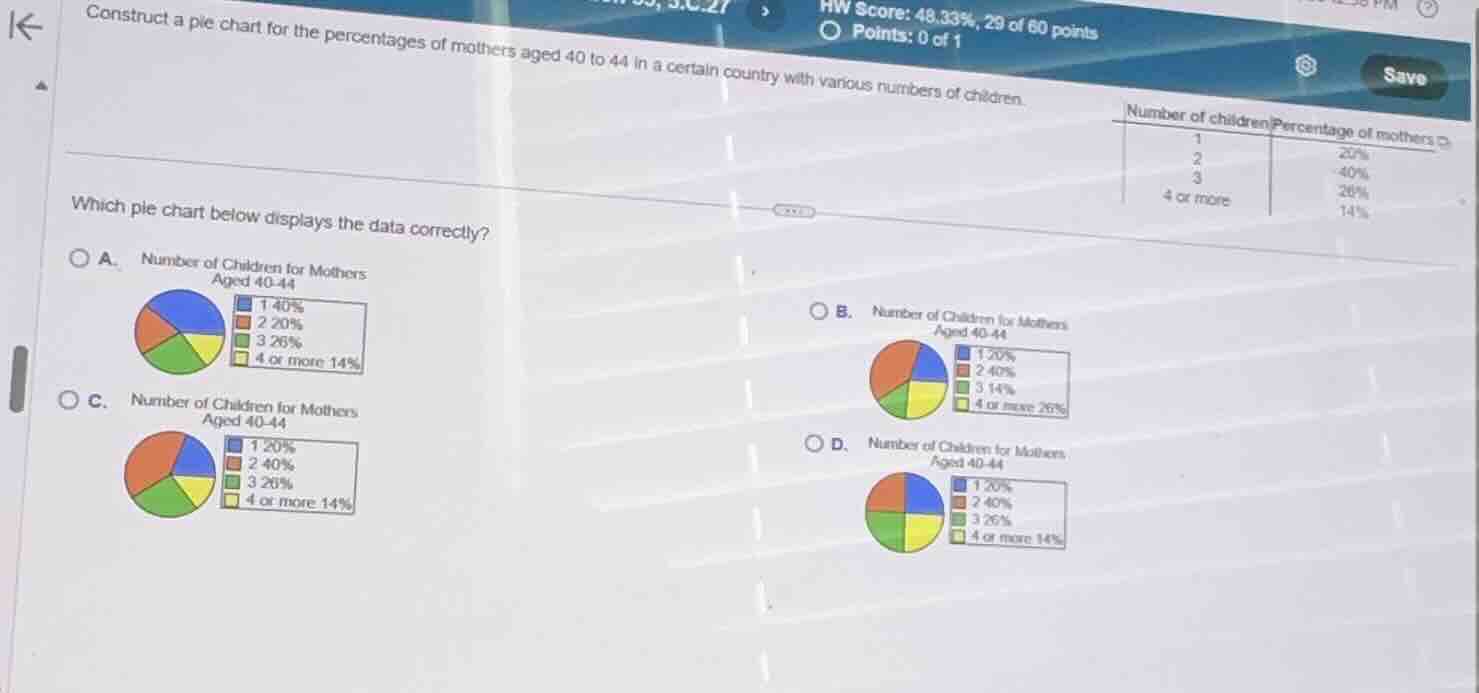
which pie chart below displays the data correctly?
Identify the given data
Using the Pie Chart Interpretation knowledge point
The problem provides a frequency distribution table showing the percentage of mothers aged 40 to 44 with various numbers of children:
- 1 child: \(20\%\)
- 2 children: \(40\%\)
- 3 children: \(26\%\)
- 4 or more children: \(14\%\)
Analyze the options
We need to find the pie chart that correctly matches both the percentages and their corresponding labels in the legend.
- Option A:
- 1 child: \(40\%\) (Incorrect, should be \(20\%\))
- 2 children: \(20\%\) (Incorrect, should be \(40\%\))
- 3 children: \(26\%\)
- 4 or more: \(14\%\)
- Option B:
- 1 child: \(20\%\)
- 2 children: \(40\%\)
- 3 children: \(14\%\) (Incorrect, should be \(26\%\))
- 4 or more: \(26\%\) (Incorrect, should be \(14\%\))
- Option C:
- 1 child: \(20\%\)
- 2 children: \(40\%\)
- 3 children: \(26\%\)
- 4 or more: \(14\%\)
- Let's check the visual sizes of the sectors:
- The sector for "2 children" (\(40\%\), orange/red) is the largest sector, representing nearly half the circle (\(144^\circ\)).
- The sector for "3 children" (\(26\%\), green) is slightly larger than a quarter (\(93.6^\circ\)).
- The sector for "1 child" (\(20\%\), blue) is slightly smaller than a quarter (\(72^\circ\)).
- The sector for "4 or more" (\(14\%\), yellow) is the smallest sector (\(50.4^\circ\)).
- This matches the data and visual proportions perfectly.
- Option D:
- 1 child: \(20\%\)
- 2 children: \(40\%\)
- 3 children: \(26\%\)
- 4 or more: \(14\%\)
- Let's check the visual sizes of the sectors in Option D:
- The yellow sector ("4 or more", \(14\%\)) and the blue sector ("1 child", \(20\%\)) are drawn as equal quarter-circles (\(25\%\) each, or \(90^\circ\)), which is visually incorrect.
Therefore, Option C is the correct representation.

Snap & solve any problem in the app
Get step-by-step solutions on Sovi AI
Photo-based solutions with guided steps
Explore more problems and detailed explanations
- (A) 1: 40%, 2: 20%, 3: 26%, 4 or more: 14%
- (B) 1: 20%, 2: 40%, 3: 14%, 4 or more: 26%
- (C) 1: 20%, 2: 40%, 3: 26%, 4 or more: 14% (Correct answer)
- (D) 1: 20%, 2: 40%, 3: 26%, 4 or more: 14% (incorrect sector proportions)