QUESTION IMAGE
Question
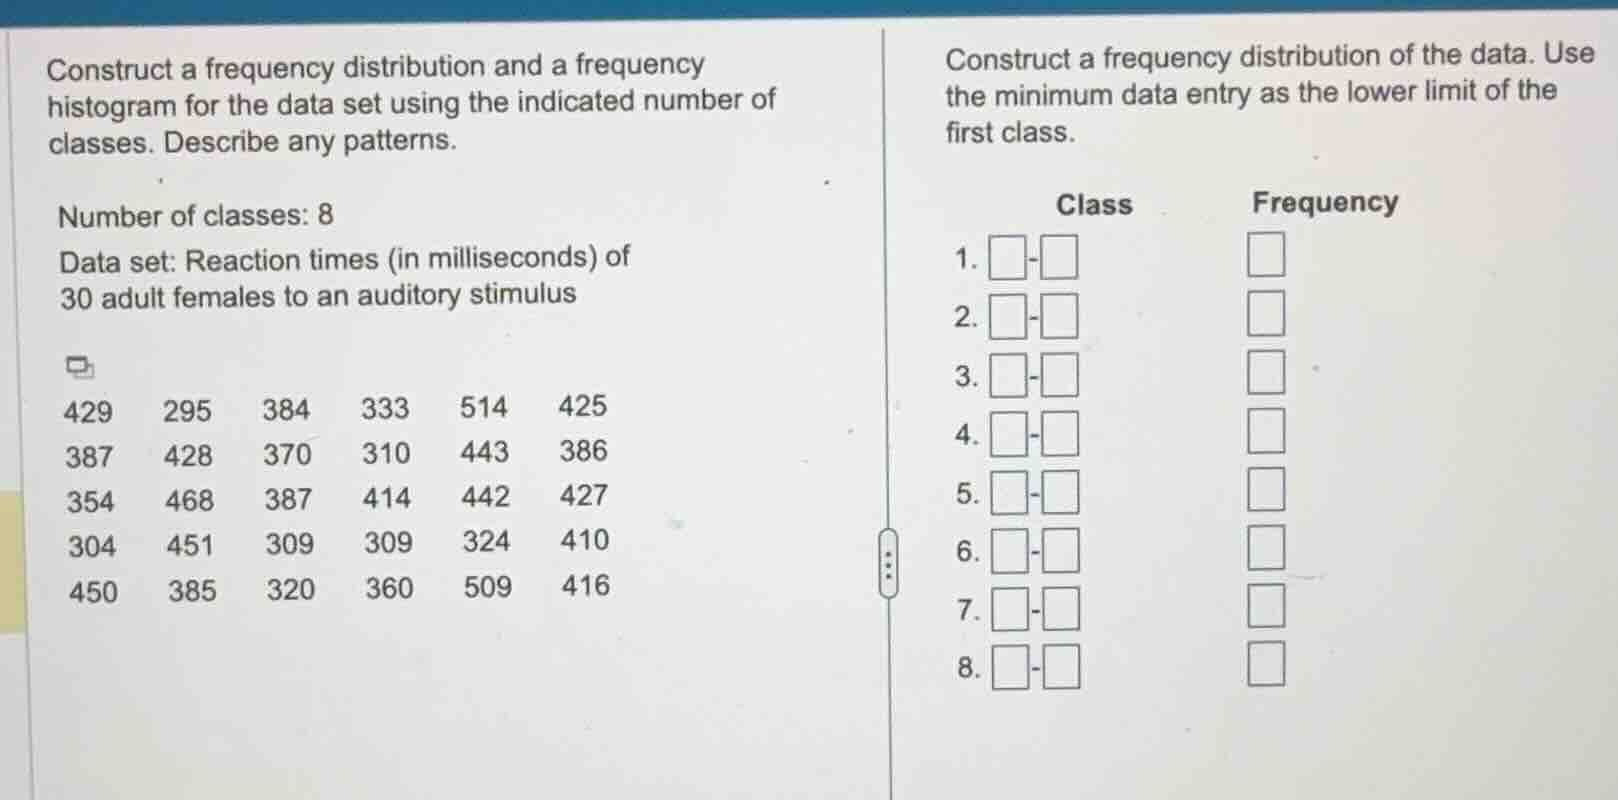
construct a frequency distribution and a frequency histogram for the data set using the indicated number of classes. describe any patterns.
number of classes: 8
data set: reaction times (in milliseconds) of 30 adult females to an auditory stimulus
429 295 384 333 514 425
387 428 370 310 443 386
354 468 387 414 442 427
304 451 309 309 324 410
450 385 320 360 509 416
construct a frequency distribution of the data. use the minimum data entry as the lower limit of the first class.
class frequency
- -
- -
- -
- -
- -
- -
- -
- -
Find the range of the data
Identify the minimum and maximum values in the given data set of 30 reaction times:
The minimum value is:
The maximum value is:
Calculate the class width
The number of classes is specified as \(8\).
Calculate the class width using the formula:
Round up to the next convenient integer:
Determine the class limits
The first class starts at the minimum data entry, \(295\).
Using a class width of \(28\), the lower limits are:
- Class 1: \(295\)
- Class 2: \(295 + 28 = 323\)
- Class 3: \(323 + 28 = 351\)
- Class 4: \(351 + 28 = 379\)
- Class 5: \(379 + 28 = 407\)
- Class 6: \(407 + 28 = 435\)
- Class 7: \(435 + 28 = 463\)
- Class 8: \(463 + 28 = 491\)
The upper limits are \(1\) less than the next lower limit:
- Class 1: \(295 - 322\)
- Class 2: \(323 - 350\)
- Class 3: \(351 - 378\)
- Class 4: \(379 - 406\)
- Class 5: \(407 - 434\)
- Class 6: \(435 - 462\)
- Class 7: \(463 - 490\)
- Class 8: \(491 - 518\)
Count frequencies for each class
Sort and count the data points falling into each class interval:
- 295–322: 295, 310, 304, 309, 309, 320 (6 values)
- 323–350: 333, 324 (2 values)
- 351–378: 370, 354, 360 (3 values)
- 379–406: 384, 387, 386, 387, 385 (5 values)
- 407–434: 429, 425, 428, 414, 427, 410, 416 (7 values)
- 435–462: 443, 442, 451, 450 (4 values)
- 463–490: 468 (1 value)
- 491–518: 514, 509 (2 values)
Total frequency check: \(6 + 2 + 3 + 5 + 7 + 4 + 1 + 2 = 30\).

Snap & solve any problem in the app
Get step-by-step solutions on Sovi AI
Photo-based solutions with guided steps
Explore more problems and detailed explanations
| No. | Class | Frequency |
|---|---|---|
| 2 | 323 - 350 | 2 |
| 3 | 351 - 378 | 3 |
| 4 | 379 - 406 | 5 |
| 5 | 407 - 434 | 7 |
| 6 | 435 - 462 | 4 |
| 7 | 463 - 490 | 1 |
| 8 | 491 - 518 | 2 |