QUESTION IMAGE
Question
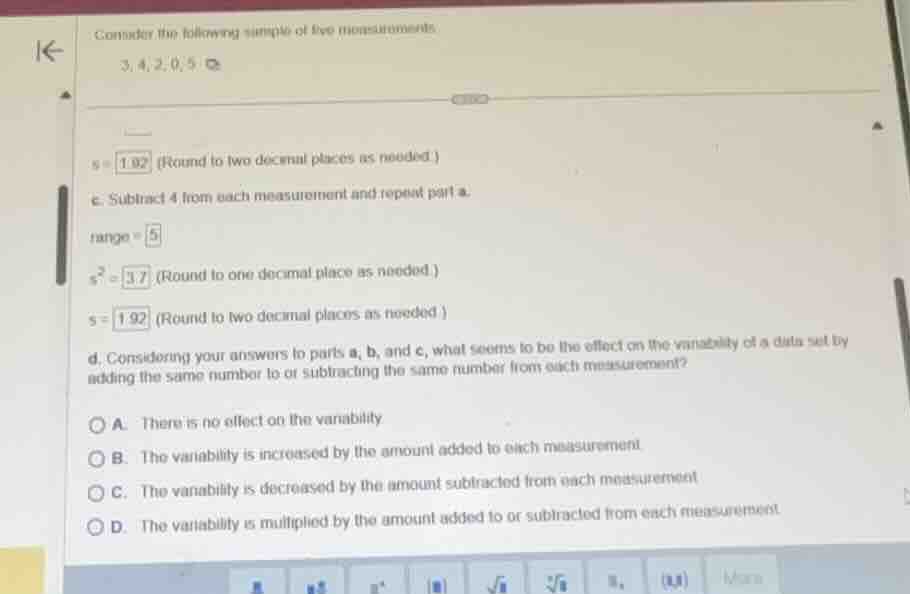
consider the following sample of five measurements:
3, 4, 2, 0, 5
\\(s = 1.92\\) (round to two decimal places as needed.)
c. subtract 4 from each measurement and repeat part a.
range = 5
\\(s^2 = 3.7\\) (round to one decimal place as needed.)
\\(s = 1.92\\) (round to two decimal places as needed.)
d. considering your answers to parts a, b, and c, what seems to be the effect on the variability of a data set by adding the same number to or subtracting the same number from each measurement?
a. there is no effect on the variability
b. the variability is increased by the amount added to each measurement
c. the variability is decreased by the amount subtracted from each measurement
d. the variability is multiplied by the amount added to or subtracted from each measurement
🆕 New Concept Discovered: Linear Transformations on Measures of Spread
How shifting data affects variability.
Step 1: Analyze the given data and calculations
The original sample of five measurements is:
In part c, we subtract \( 4 \) from each measurement, resulting in the new data set:
Comparing the variability measures calculated for both the original and shifted data sets:
- Original data set:
- \(\text{range} = 5\)
- \(s^2 = 3.7\)
- \(s = 1.92\)
- Shifted data set (after subtracting 4):
- \(\text{range} = 5\)
- \(s^2 = 3.7\)
- \(s = 1.92\)
Step 2: Determine the effect of shifting on variability
Adding or subtracting a constant value to every data point shifts the entire distribution along the number line without changing the distance between the data points.
Because measures of variability (such as range, variance \(s^2\), and standard deviation \(s\)) measure how spread out the data points are relative to each other, shifting the data has no effect on these measures.
Therefore, there is no effect on the variability.

Snap & solve any problem in the app
Get step-by-step solutions on Sovi AI
Photo-based solutions with guided steps
Explore more problems and detailed explanations
A. There is no effect on the variability