QUESTION IMAGE
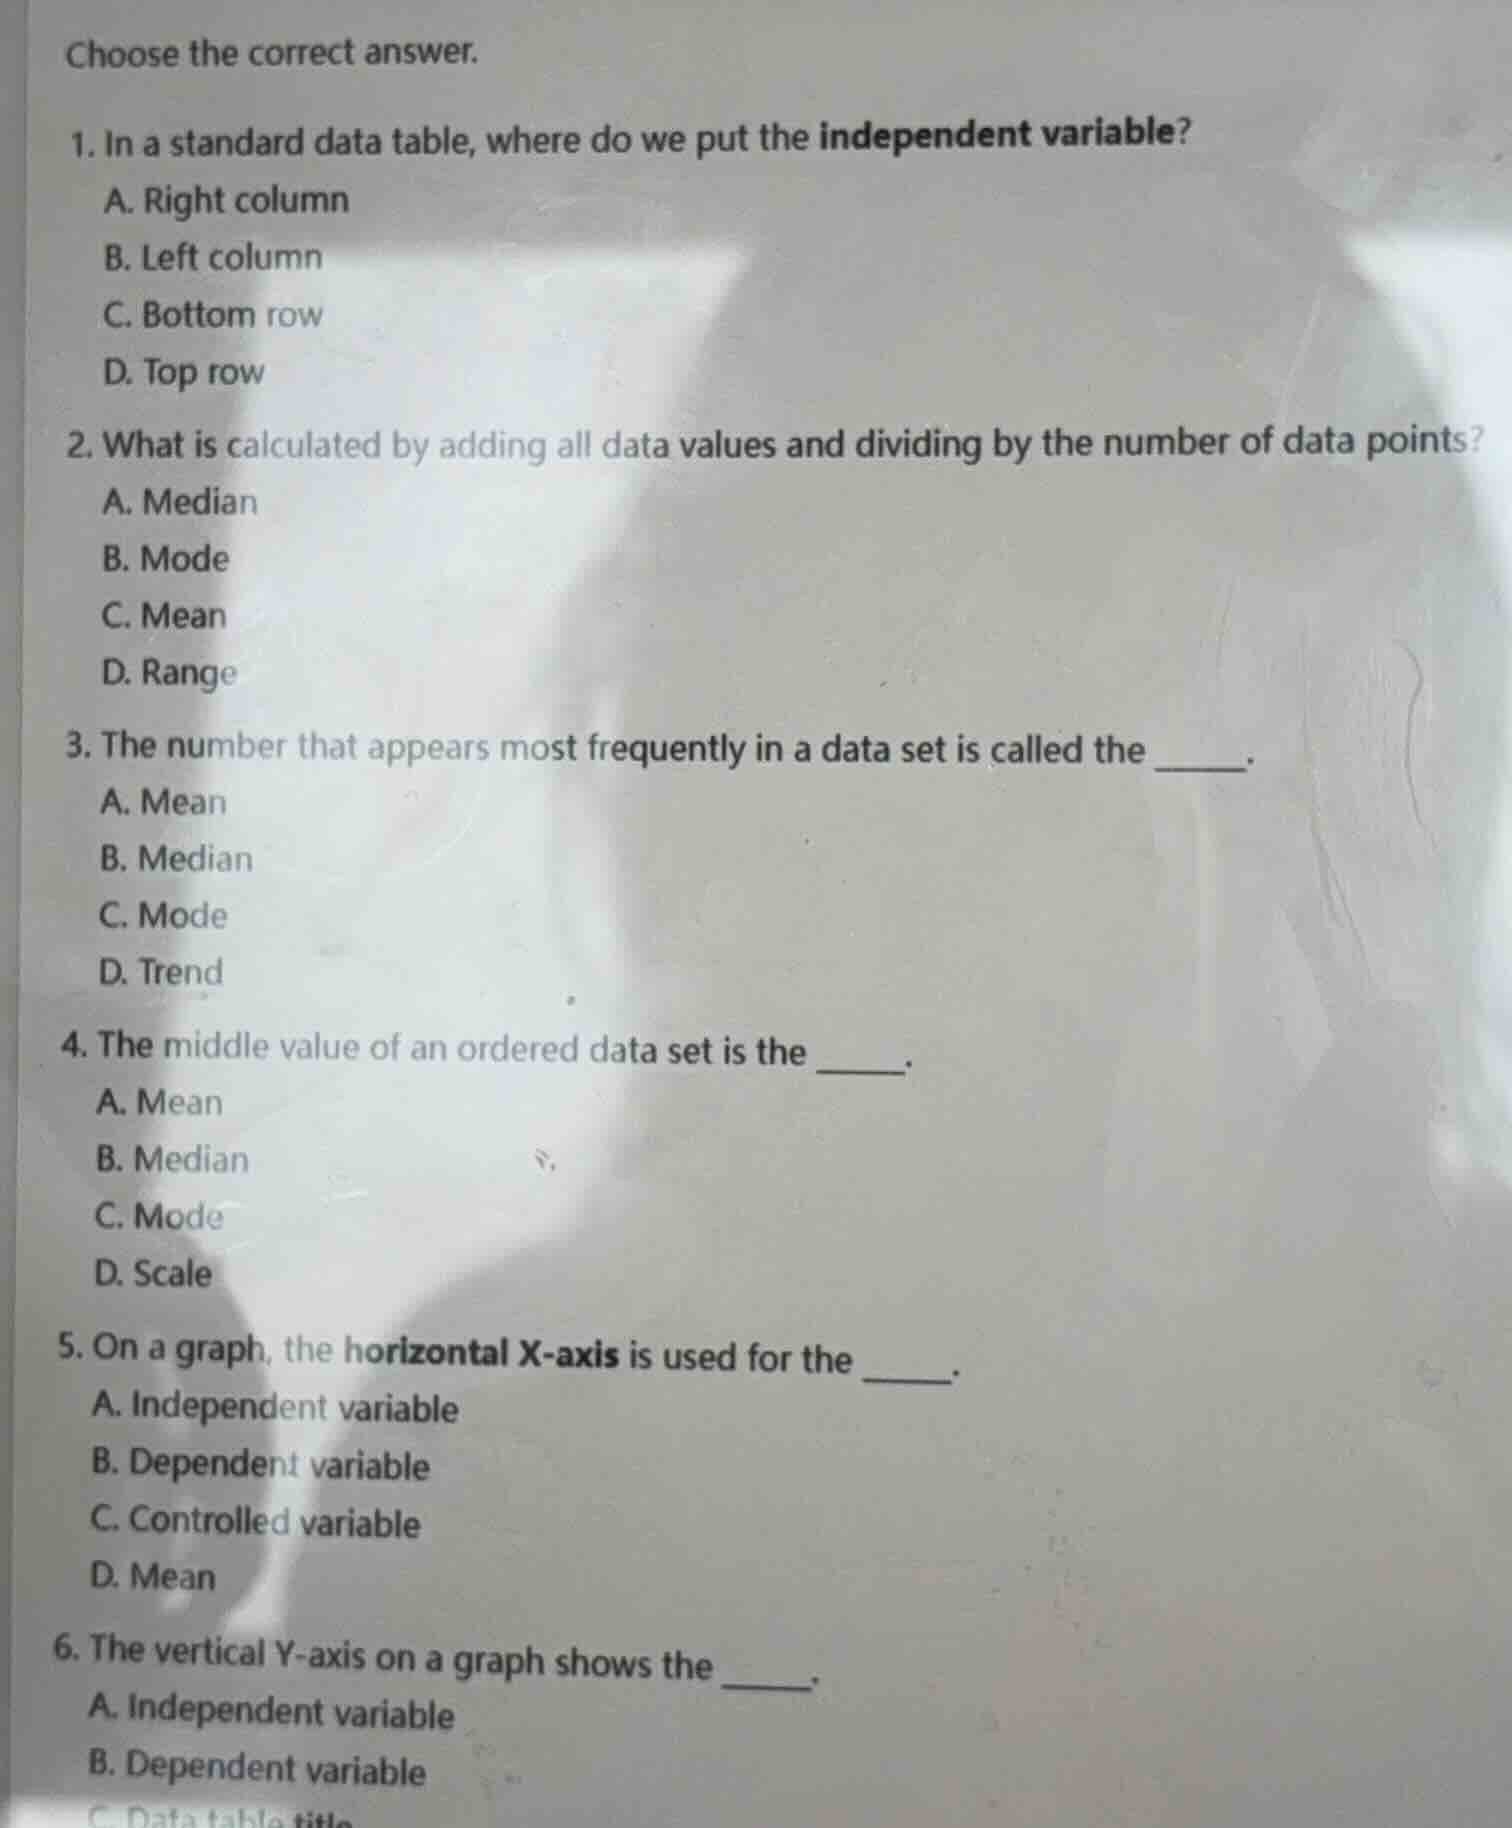
Question
choose the correct answer.
- in a standard data table, where do we put the independent variable?
a. right column
b. left column
c. bottom row
d. top row
- what is calculated by adding all data values and dividing by the number of data points?
a. median
b. mode
c. mean
d. range
- the number that appears most frequently in a data set is called the ______.
a. mean
b. median
c. mode
d. trend
- the middle value of an ordered data set is the ______.
a. mean
b. median
c. mode
d. scale
- on a graph, the horizontal x-axis is used for the ______.
a. independent variable
b. dependent variable
c. controlled variable
d. mean
- the vertical y-axis on a graph shows the ______.
a. independent variable
b. dependent variable
Analyze independent variables in data tables
In standard scientific data tables, the independent variable is placed in the left column, while the dependent variable is placed in the right column.
Identify measures of central tendency
- Adding all values and dividing by the count defines the mean.
- The value appearing most frequently is the mode.
- The middle value of an ordered data set is the median.
Identify variables on graph axes
- The horizontal X-axis is used for the independent variable.
- The vertical Y-axis shows the dependent variable.

Snap & solve any problem in the app
Get step-by-step solutions on Sovi AI
Photo-based solutions with guided steps
Explore more problems and detailed explanations
- (B)
- (C)
- (C)
- (B)
- (A)
- (B)