QUESTION IMAGE
Question
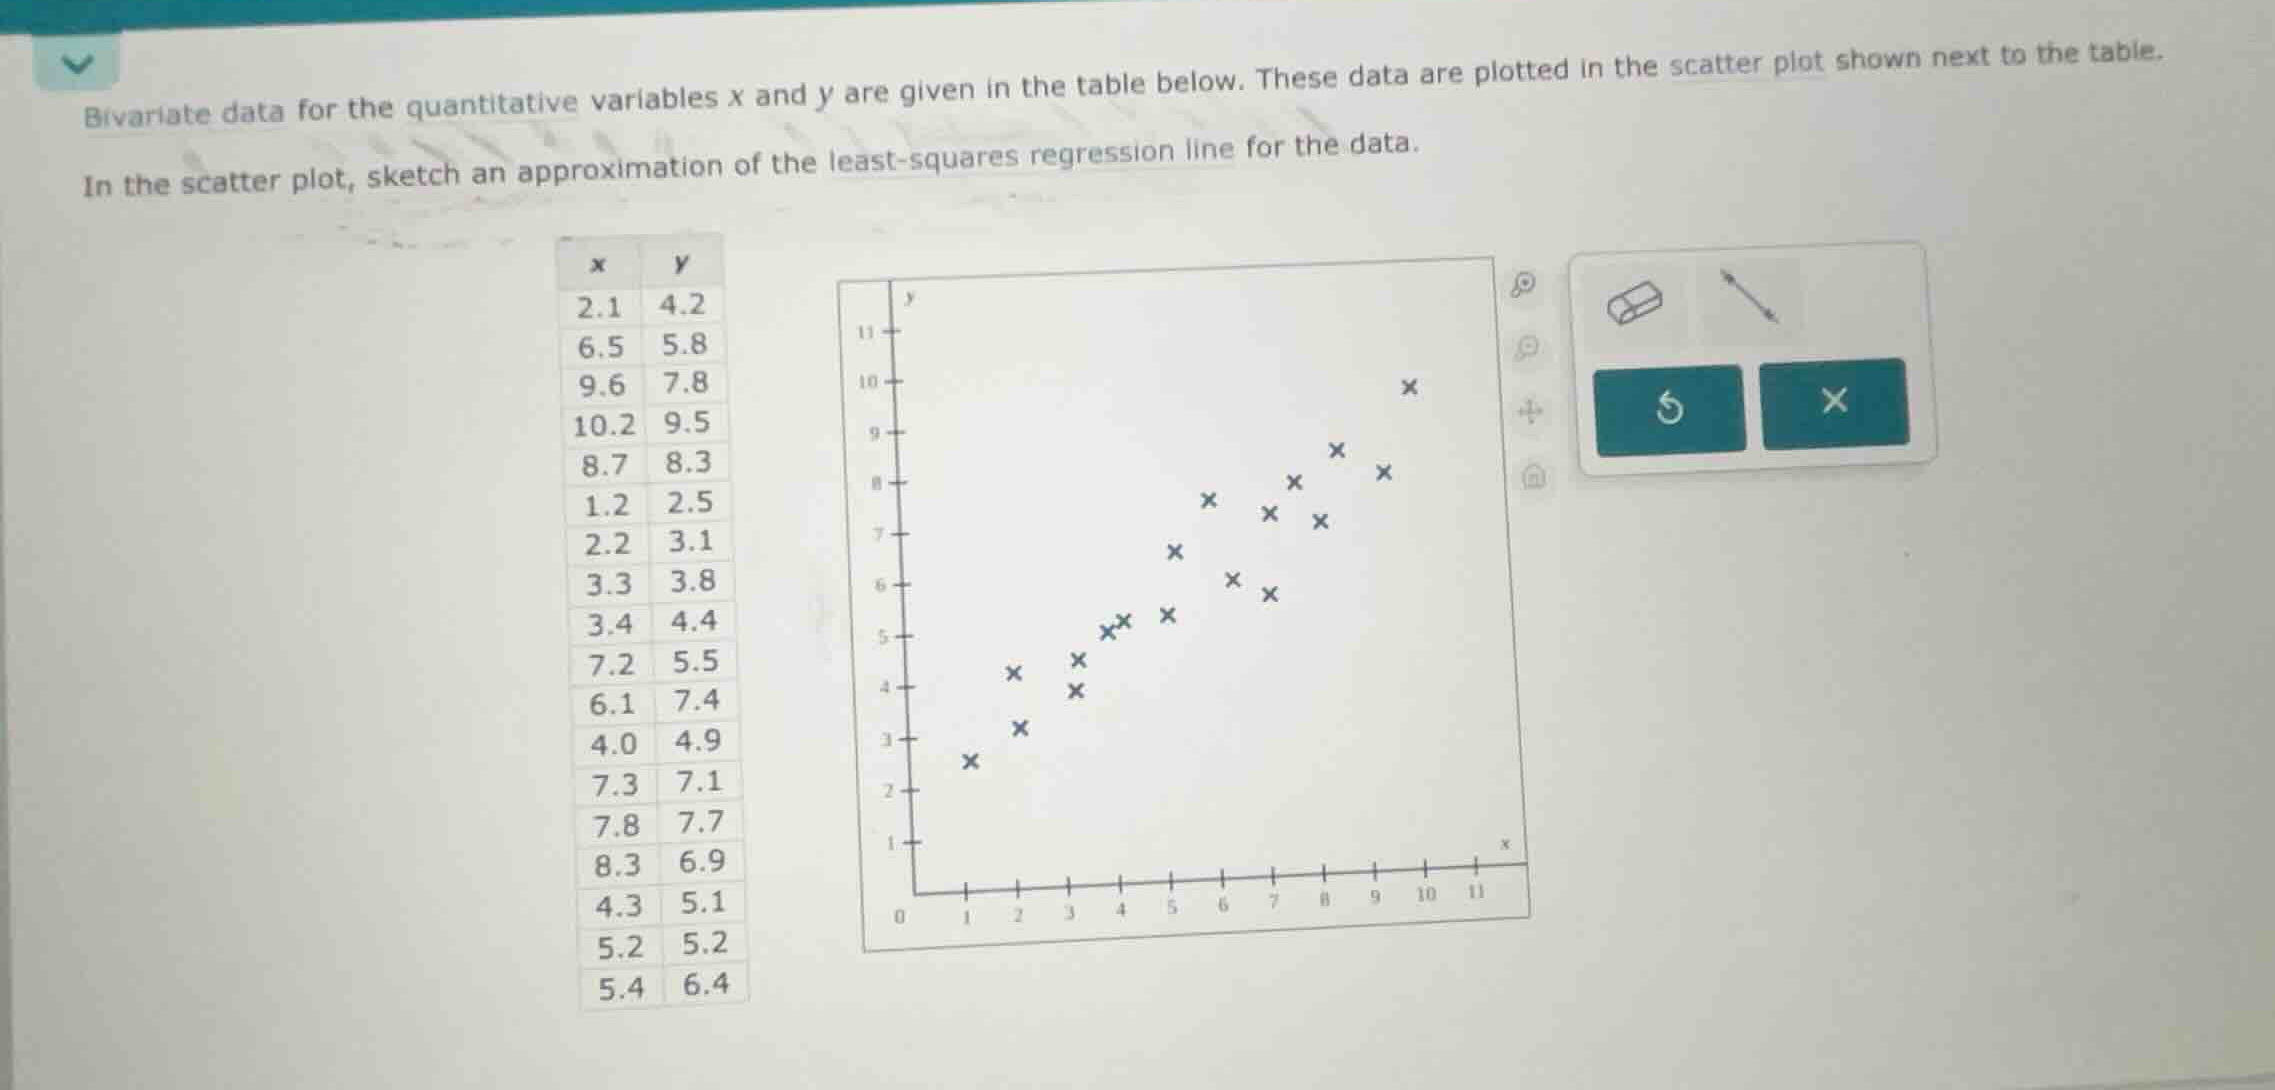
bivariate data for the quantitative variables x and y are given in the table below. these data are plotted in the scatter plot shown next to the table.
in the scatter plot, sketch an approximation of the least-squares regression line for the data.
Calculate summary statistics
We first calculate the sample means of the variables \(x\) and \(y\) to find the centroid \((\bar{x}, \bar{y})\) of the data.
Using the Sample Mean knowledge point:
The number of data points is \(n = 18\).
Sum of \(x\):
Sum of \(y\):
Calculate sums of squares
To find the slope \(b_1\) of the least-squares regression line, we compute the sum of squares \(SS_{xx}\) and sum of products \(SS_{xy}\).
The formulas are:
Calculating the individual terms:
Determine the regression line equation
Now we calculate the slope \(b_1\) and the y-intercept \(b_0\) of the regression line:
Thus, the equation of the least-squares regression line is:
Identify key plotting points
To sketch the line accurately on the scatter plot, we find two points on the line:
- For \(x = 0\): \(\hat{y} \approx 2.47\)
- For \(x = 10\): \(\hat{y} = 0.631(10) + 2.473 \approx 8.78\)

Snap & solve any problem in the app
Get step-by-step solutions on Sovi AI
Photo-based solutions with guided steps
Explore more problems and detailed explanations
The least-squares regression line is approximately given by the equation:
To sketch this line on the scatter plot, draw a straight line passing through the following approximate coordinates:
- \(y\)-intercept at \((0, 2.5)\)
- Point at \((10, 8.8)\)