QUESTION IMAGE
Question
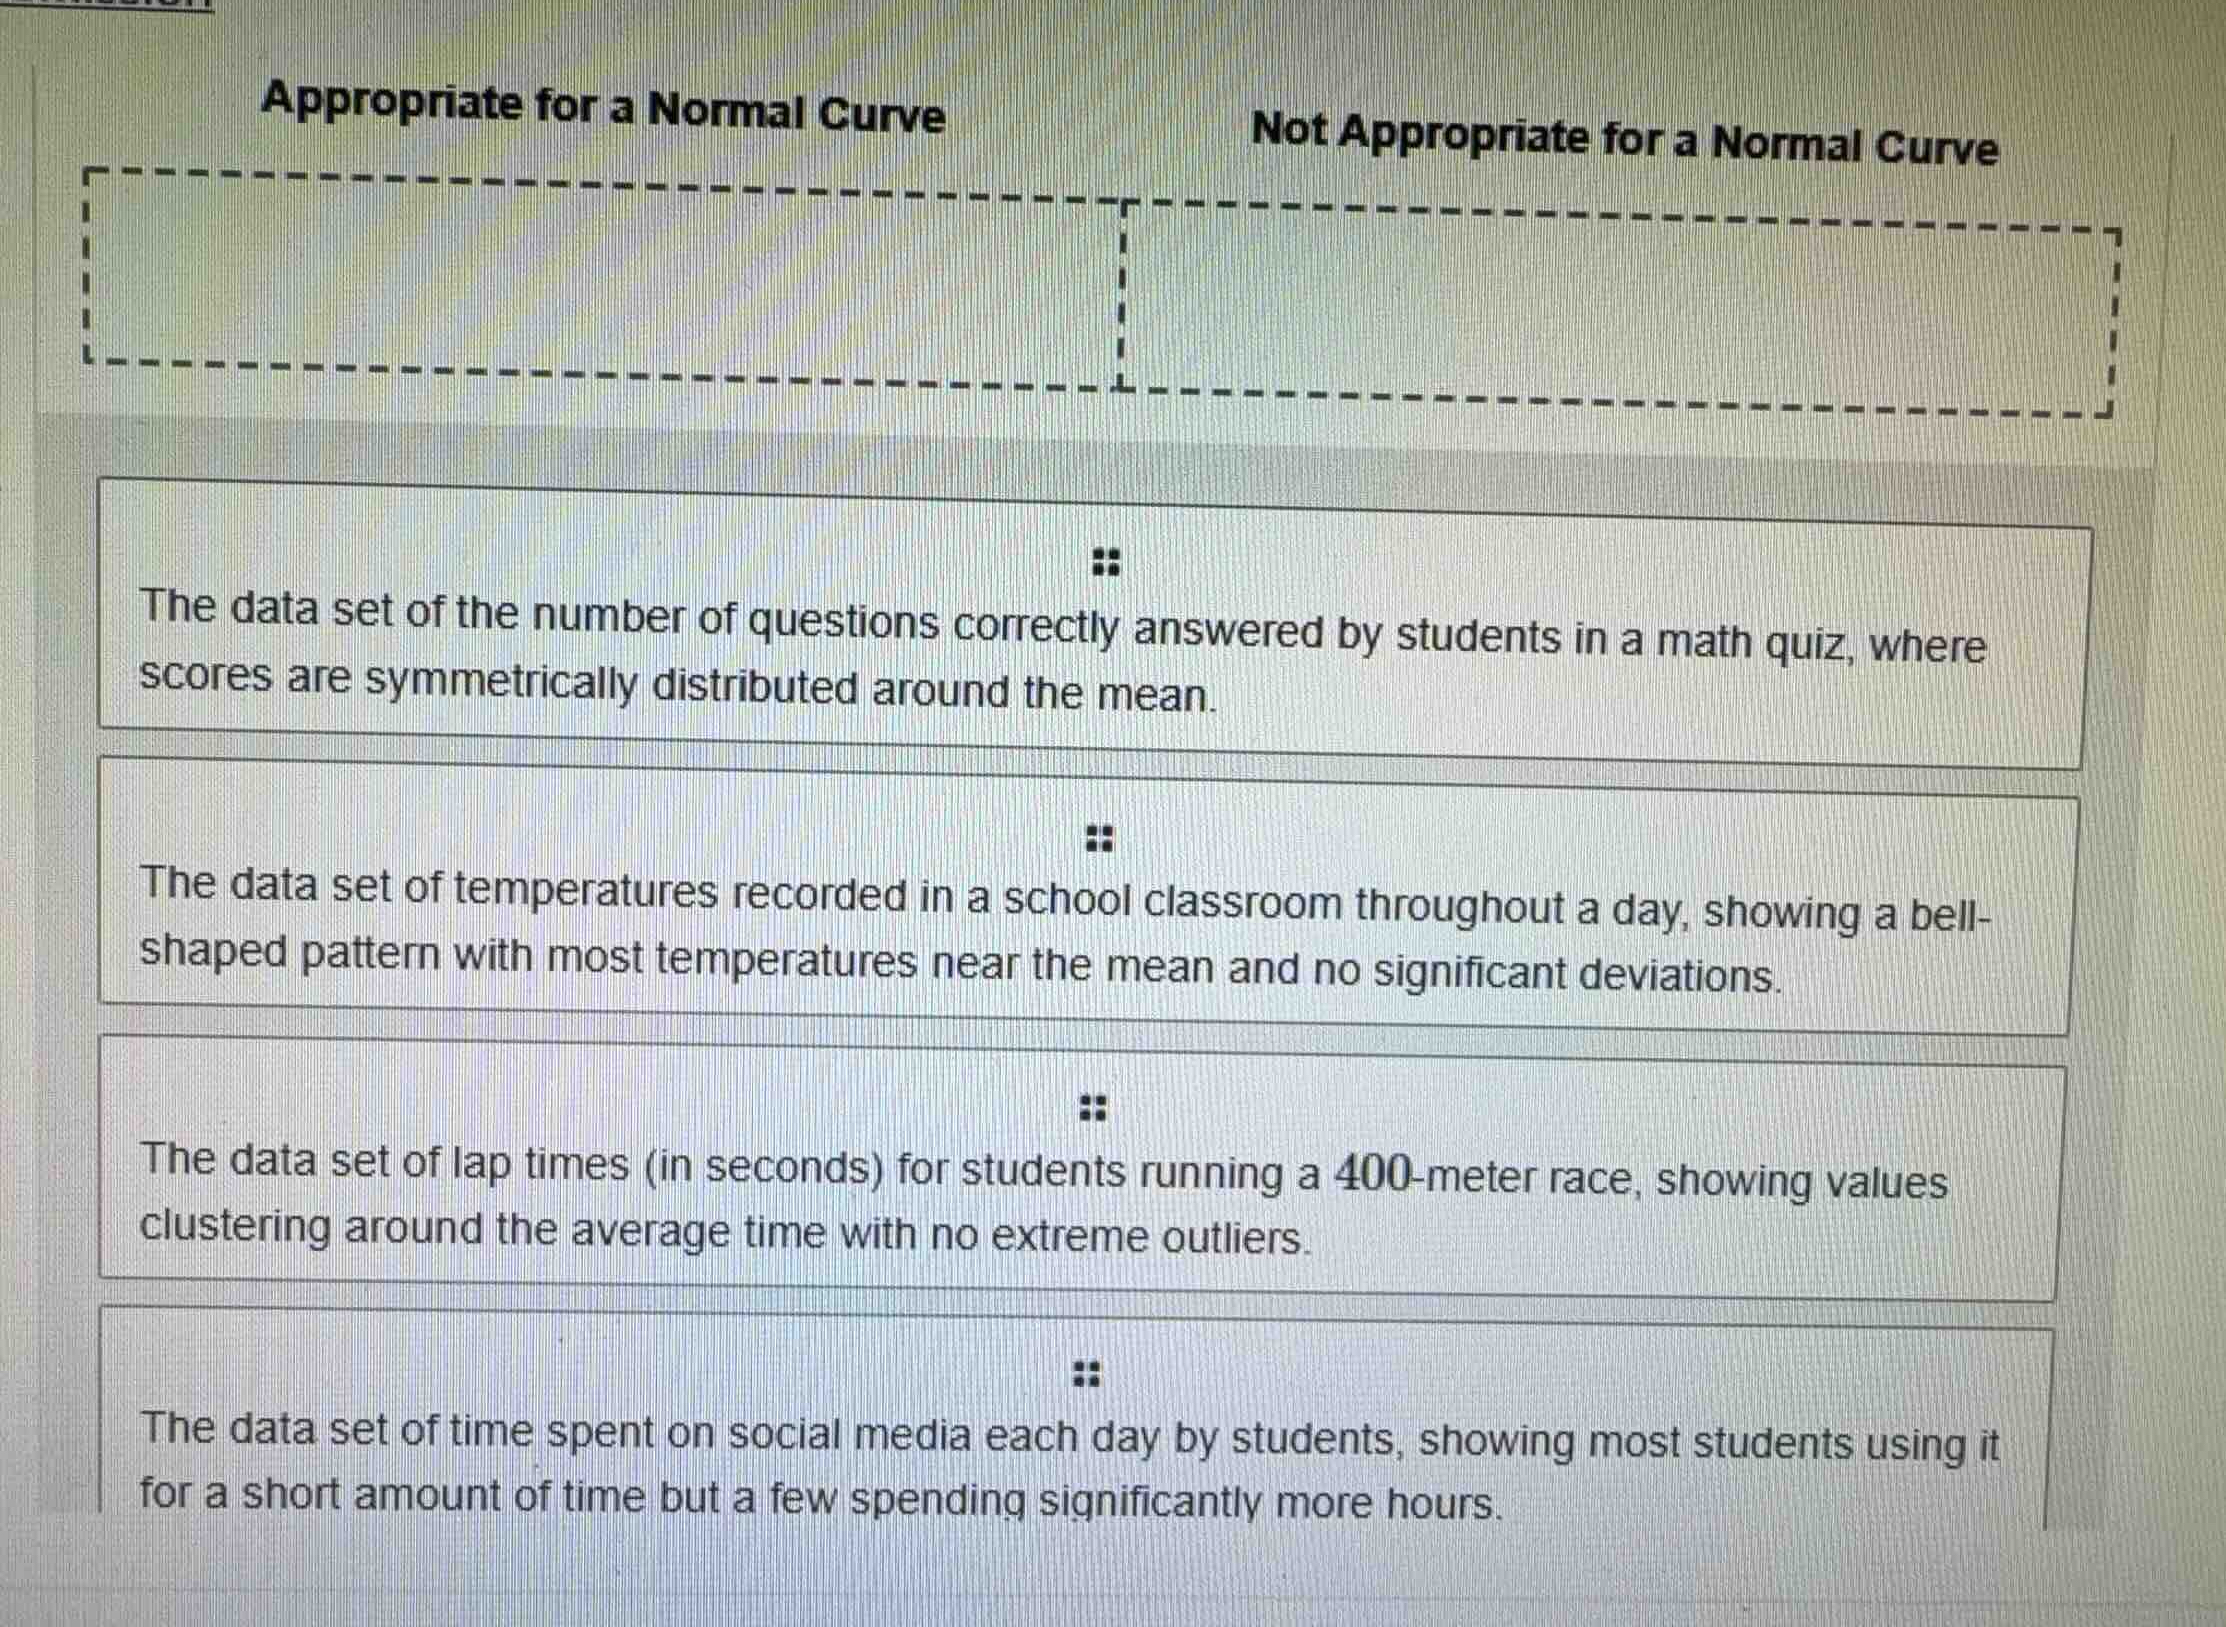
appropriate for a normal curve
not appropriate for a normal curve
the data set of the number of questions correctly answered by students in a math quiz, where scores are symmetrically distributed around the mean.
the data set of temperatures recorded in a school classroom throughout a day, showing a bell-shaped pattern with most temperatures near the mean and no significant deviations.
the data set of lap times (in seconds) for students running a 400-meter race, showing values clustering around the average time with no extreme outliers.
the data set of time spent on social media each day by students, showing most students using it for a short amount of time but a few spending significantly more hours.
Analyze symmetry and bell-shape criteria
A normal distribution is symmetric, bell-shaped, clusters around the mean, and has thin tails with no extreme outliers or heavy skewness.
Evaluate each data set scenario
- Scenario 1 (Math quiz scores): "Symmetrically distributed around the mean" matches the symmetry requirement of a normal curve.
- Scenario 2 (Classroom temperatures): "Showing a bell-shaped pattern with most temperatures near the mean and no significant deviations" directly describes a normal distribution.
- Scenario 3 (Lap times): "Clustering around the average time with no extreme outliers" describes a symmetric, single-peaked distribution suitable for a normal curve.
- Scenario 4 (Social media time): "Most students using it for a short amount of time but a few spending significantly more hours" describes a highly right-skewed distribution, which is not appropriate for a symmetric normal curve.
Categorize into target groups
- Appropriate for a Normal Curve:
- The data set of the number of questions correctly answered by students in a math quiz, where scores are symmetrically distributed around the mean.
- The data set of temperatures recorded in a school classroom throughout a day, showing a bell-shaped pattern with most temperatures near the mean and no significant deviations.
- The data set of lap times (in seconds) for students running a 400-meter race, showing values clustering around the average time with no extreme outliers.
- Not Appropriate for a Normal Curve:
- The data set of time spent on social media each day by students, showing most students using it for a short amount of time but a few spending significantly more hours.

Snap & solve any problem in the app
Get step-by-step solutions on Sovi AI
Photo-based solutions with guided steps
Explore more problems and detailed explanations
Appropriate for a Normal Curve
- The data set of the number of questions correctly answered by students in a math quiz, where scores are symmetrically distributed around the mean.
- The data set of temperatures recorded in a school classroom throughout a day, showing a bell-shaped pattern with most temperatures near the mean and no significant deviations.
- The data set of lap times (in seconds) for students running a 400-meter race, showing values clustering around the average time with no extreme outliers.
Not Appropriate for a Normal Curve
- The data set of time spent on social media each day by students, showing most students using it for a short amount of time but a few spending significantly more hours.