QUESTION IMAGE
Question
the accompanying table shows the ticket sales of the 15 highest grossing movies of all time, adjusted for inflation, in millions of dollars.
a) construct a frequency distribution with a first class of 877-996.
b) construct a histogram.
c) construct a frequency polygon.
ticket sales in millions of dollars
1826 1685 1331 1281 1250
1130 1127 1124 1024 990
990 968 944 898 883
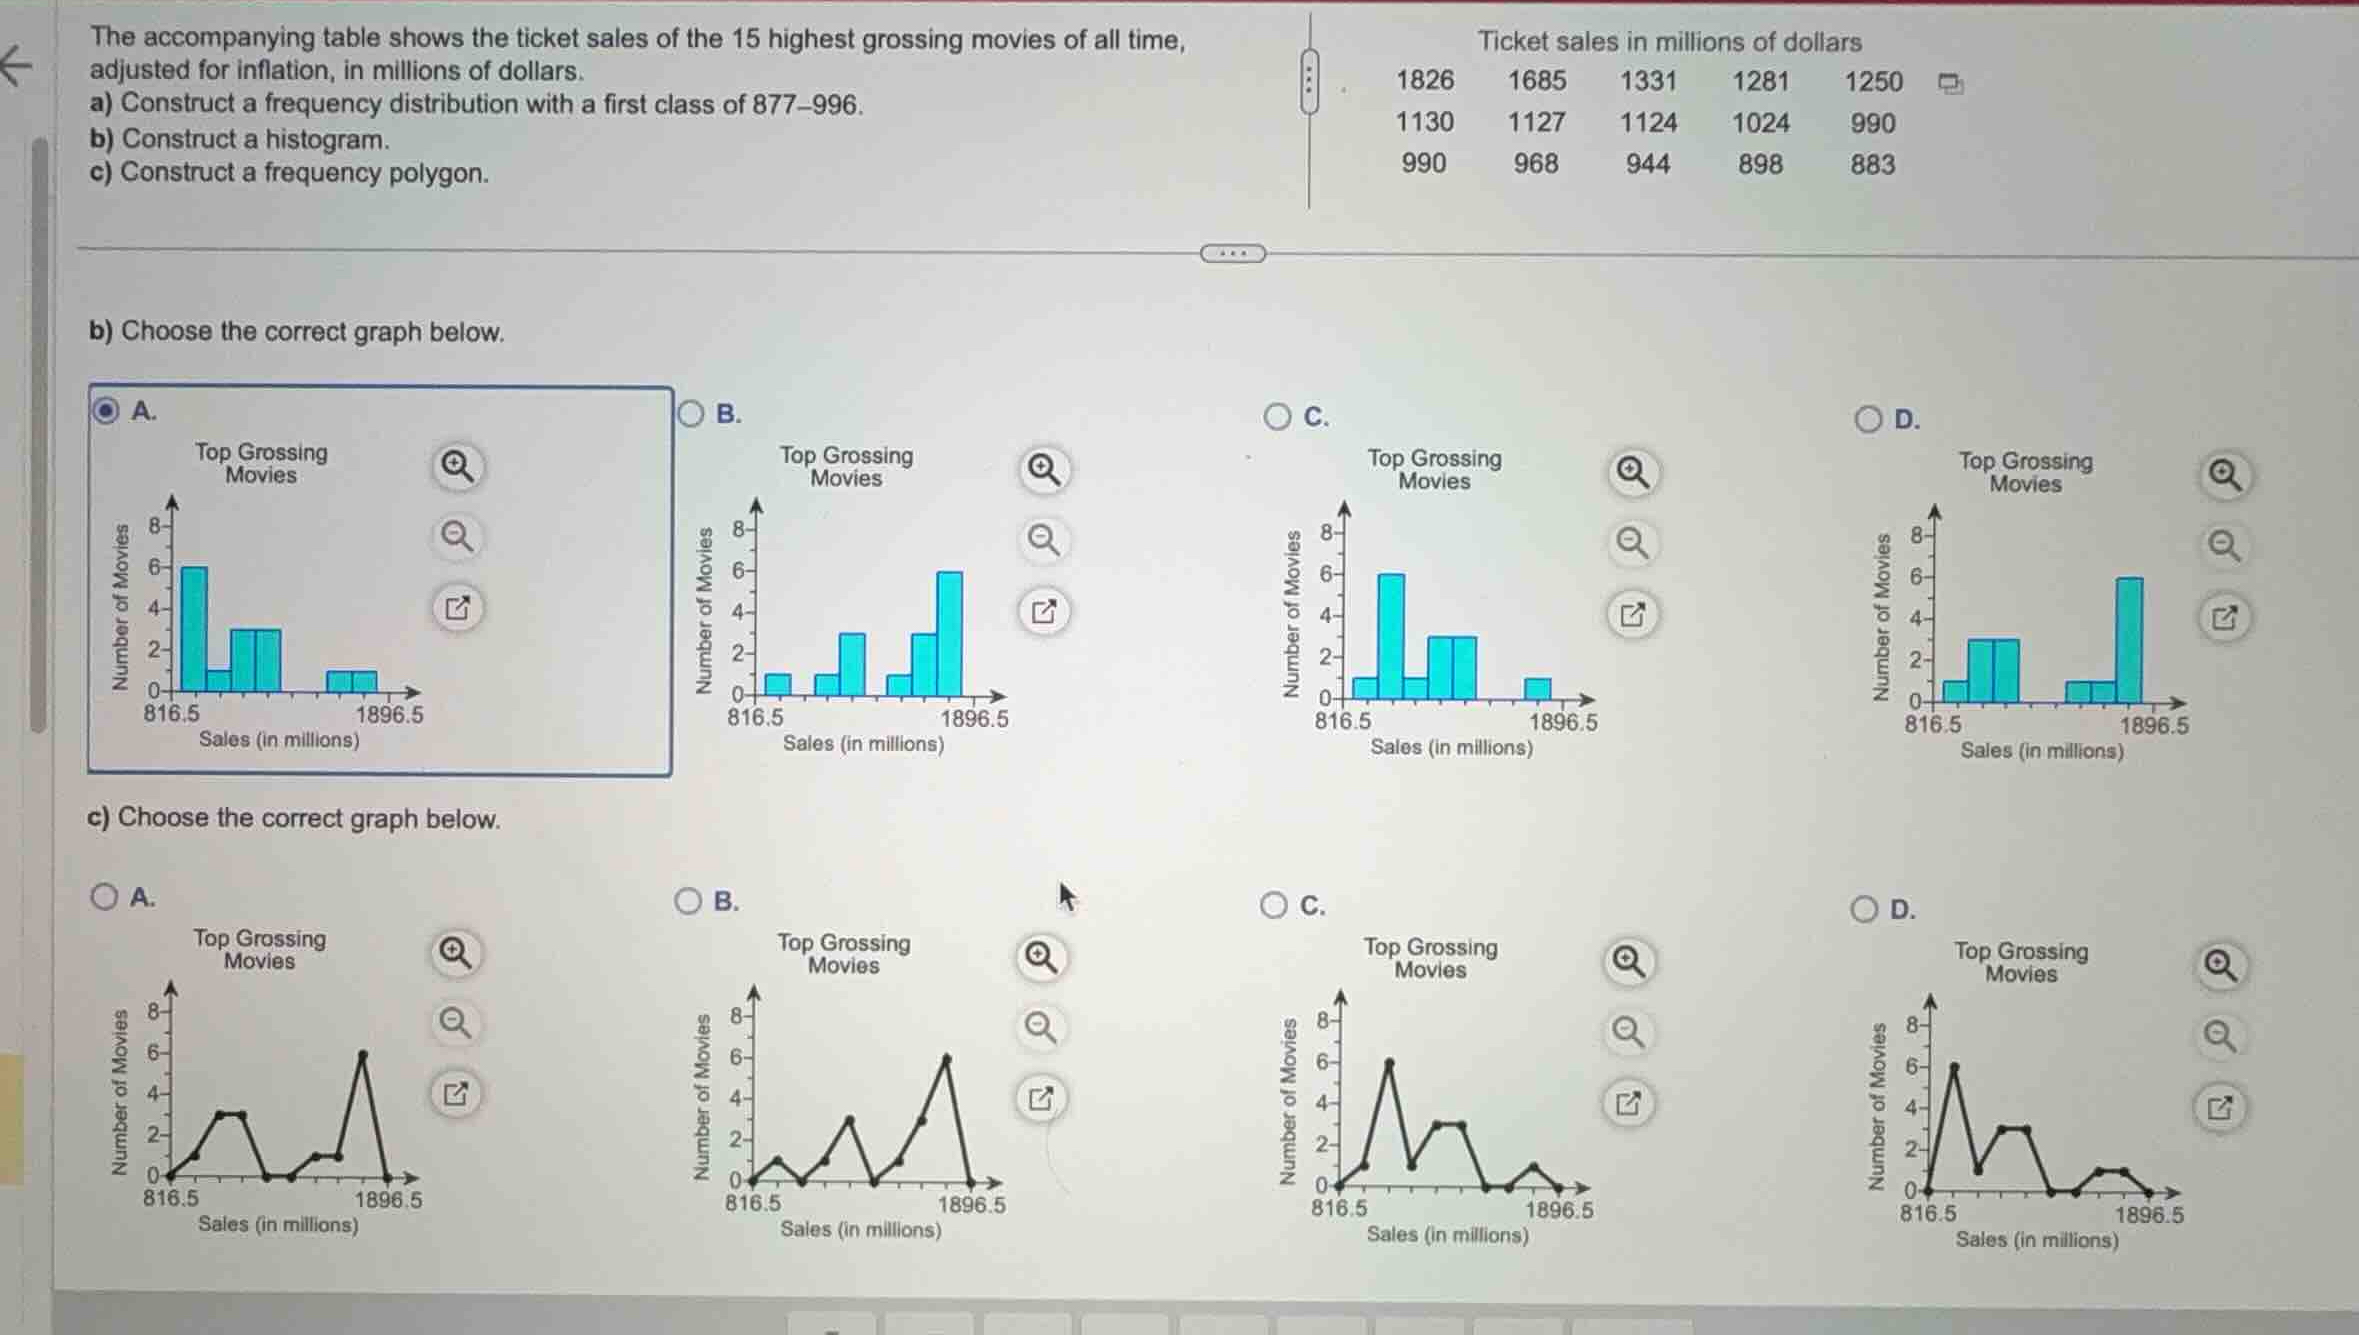
b) choose the correct graph below.
c) choose the correct graph below.
Determine the frequency distribution
Using the Frequency Distribution knowledge point
The data set consists of 15 values:
1826, 1685, 1331, 1281, 1250, 1130, 1127, 1124, 1024, 990, 990, 968, 944, 898, 883.
The first class is specified as 877–996.
The class width is:
We construct the classes and count the frequencies:
- 877–996: 883, 898, 944, 968, 990, 990 (6 values) -> Frequency = 6
- 997–1116: 1024 (1 value) -> Frequency = 1
- 1117–1236: 1124, 1127, 1130 (3 values) -> Frequency = 3
- 1237–1356: 1250, 1281, 1331 (3 values) -> Frequency = 3
- 1357–1476: None (0 values) -> Frequency = 0
- 1477–1596: None (0 values) -> Frequency = 0
- 1597–1716: 1685 (1 value) -> Frequency = 1
- 1717–1836: 1826 (1 value) -> Frequency = 1
The frequency sequence is: 6, 1, 3, 3, 0, 0, 1, 1.
Identify the correct histogram
Using the Histogram Interpretation knowledge point
The class boundaries for the histogram are:
- Lower boundary of first class: \(877 - 0.5 = 876.5\) (or starting near 816.5 with a preceding empty class boundary, but looking at the options, the labels start at 816.5. Let's check the class boundaries: \(876.5, 996.5, 1116.5, 1236.5, 1356.5, 1476.5, 1596.5, 1716.5, 1836.5\)).
- Let's match the bar heights corresponding to our frequencies: 6, 1, 3, 3, 0, 0, 1, 1.
- Looking at Graph A:
- First bar height: 6
- Second bar height: 1
- Third bar height: 3
- Fourth bar height: 3
- Fifth bar height: 0
- Sixth bar height: 0
- Seventh bar height: 1
- Eighth bar height: 1
This perfectly matches our frequency sequence. Thus, Graph A is correct for part b).
Identify the correct frequency polygon
Using the Frequency Polygon Interpretation knowledge point
A frequency polygon plots points at the class midpoints with heights equal to the class frequencies, and connects them, anchoring to the horizontal axis at the midpoints of empty classes on both ends.
- The frequency sequence is: 6, 1, 3, 3, 0, 0, 1, 1.
- Looking at the options for part c):
- Graph C shows the peak heights at: 6, then drops to 1, then rises to 3, then stays at 3, then drops to 0, then stays at 0, then rises to 1, then 1, and anchors to 0 at the ends.
- Let's verify the peaks in Graph C:
- First peak: 6
- Second peak: 1
- Third peak: 3
- Fourth peak: 3
- Fifth peak: 0
- Sixth peak: 0
- Seventh peak: 1
- Eighth peak: 1
This perfectly matches our frequency sequence. Thus, Graph C is correct for part c).

Snap & solve any problem in the app
Get step-by-step solutions on Sovi AI
Photo-based solutions with guided steps
Explore more problems and detailed explanations
Question 1
- (A) First bar height 6, second 1, third 3, fourth 3, then two empty classes, then two bars of height 1 (Correct answer)
- (B) First bar height 1, rising to a peak of 6 near the right side
- (C) First bar height 1, second 6, third 1, fourth 3, fifth 3, then one bar of height 1 near the right
- (D) First bar height 1, second 3, third 3, then a peak of 6 near the right side
Question 2
- (A) First peak at 1, second peak at 3, third peak at 1, fourth peak at 6
- (B) First peak at 1, second peak at 3, third peak at 6
- (C) First peak at 6, dropping to 1, rising to 3, staying at 3, dropping to 0, then rising to 1 and 1 (Correct answer)
- (D) First peak at 6, dropping to 1, rising to 3, staying at 3, then dropping and staying low