QUESTION IMAGE
Question
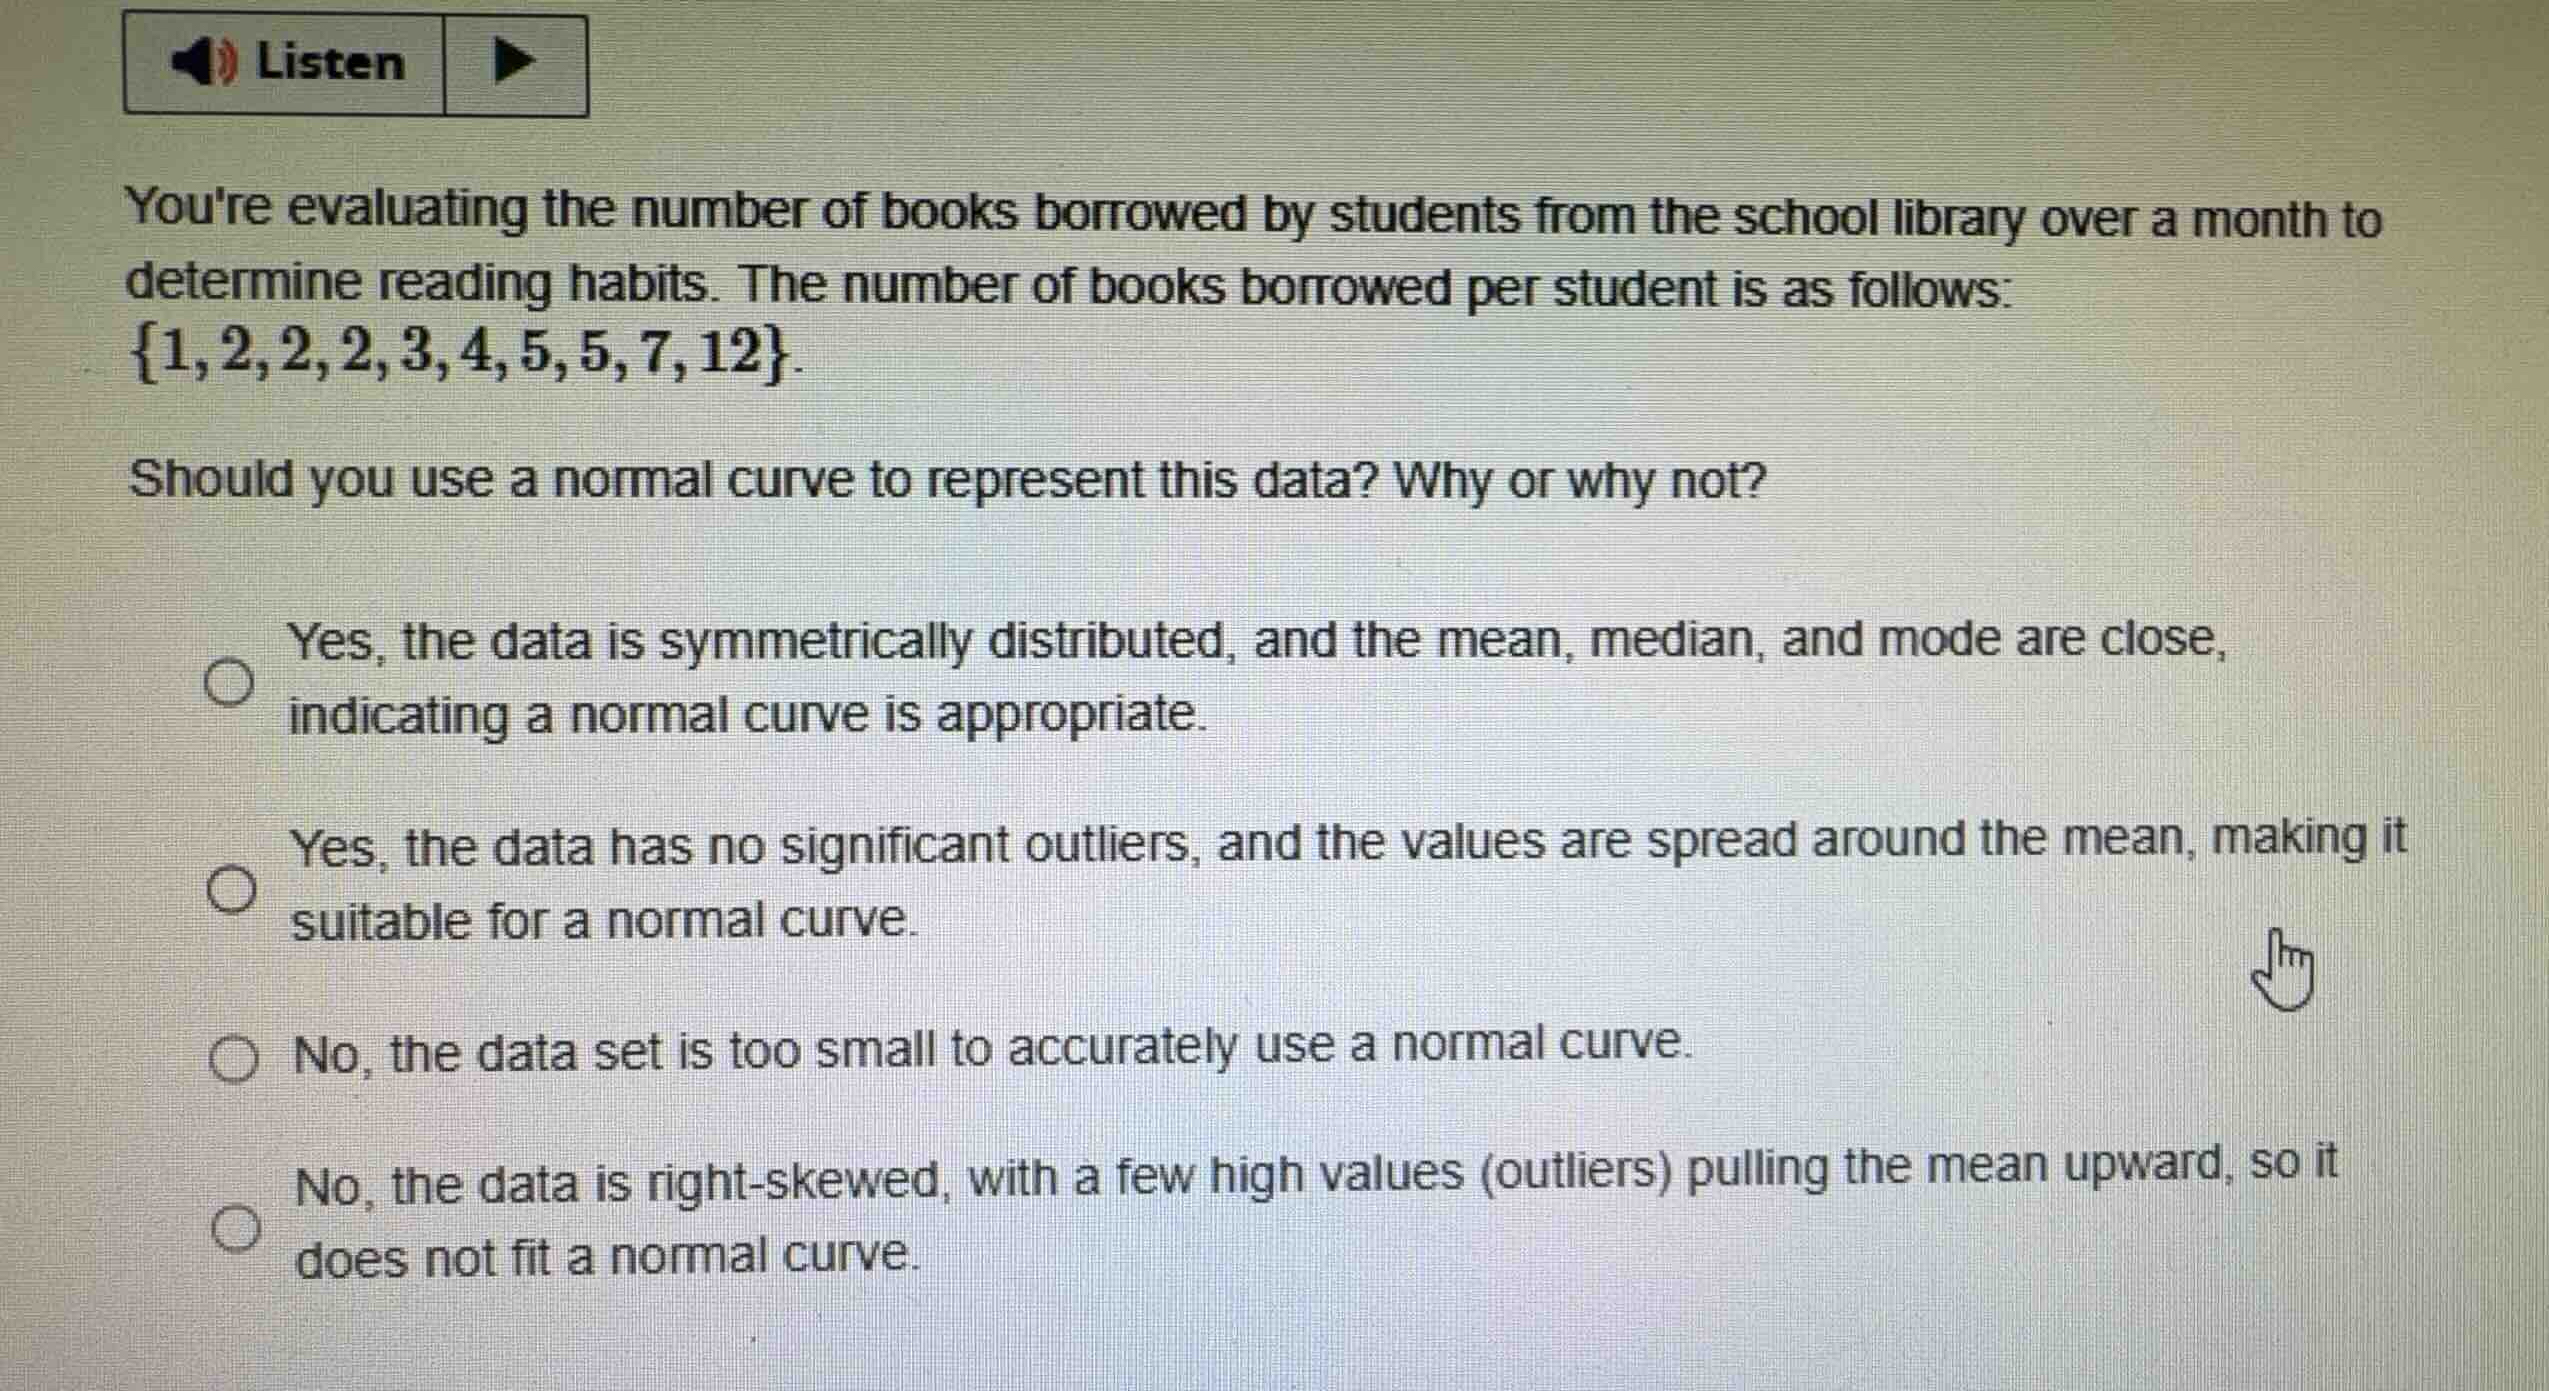
youre evaluating the number of books borrowed by students from the school library over a month to determine reading habits. the number of books borrowed per student is as follows:
\\{1, 2, 2, 2, 3, 4, 5, 5, 7, 12\\}.
should you use a normal curve to represent this data? why or why not?
- yes, the data is symmetrically distributed, and the mean, median, and mode are close, indicating a normal curve is appropriate.
- yes, the data has no significant outliers, and the values are spread around the mean, making it suitable for a normal curve.
- no, the data set is too small to accurately use a normal curve.
- no, the data is right-skewed, with a few high values (outliers) pulling the mean upward, so it does not fit a normal curve.
Calculate central tendency measures
We analyze the dataset:
The number of data points is \(n = 10\).
The mean is:
The median (average of the 5th and 6th values, 3 and 4) is:
The mode (most frequent value) is \(2\).
Analyze distribution shape
We compare the calculated measures:
This ordering indicates a right-skewed distribution.
The value \(12\) is much larger than the rest, acting as an outlier that pulls the mean upward.
Evaluate normal curve suitability
A normal distribution must be symmetric.
Since this dataset is strongly right-skewed, a normal curve is not appropriate.
This matches the fourth option.

Snap & solve any problem in the app
Get step-by-step solutions on Sovi AI
Photo-based solutions with guided steps
Explore more problems and detailed explanations
- (A) Yes, the data is symmetrically distributed, and the mean, median, and mode are close, indicating a normal curve is appropriate.
- (B) Yes, the data has no significant outliers, and the values are spread around the mean, making it suitable for a normal curve.
- (C) No, the data set is too small to accurately use a normal curve.
- (D) No, the data is right-skewed, with a few high values (outliers) pulling the mean upward, so it does not fit a normal curve. (Correct answer)