QUESTION IMAGE
Question
level by class (assassin and slayer)
coloured by dead:
min: 53
lq: 60
med: 71
mean: 72.798
uq: 89
max: 94
sd: 13.524
num: 94
assassin
class
min: 53
lq: 72
med: 89
mean: 81.868
uq: 91
max: 99
sd: 12.184
num: 806
slayer
level
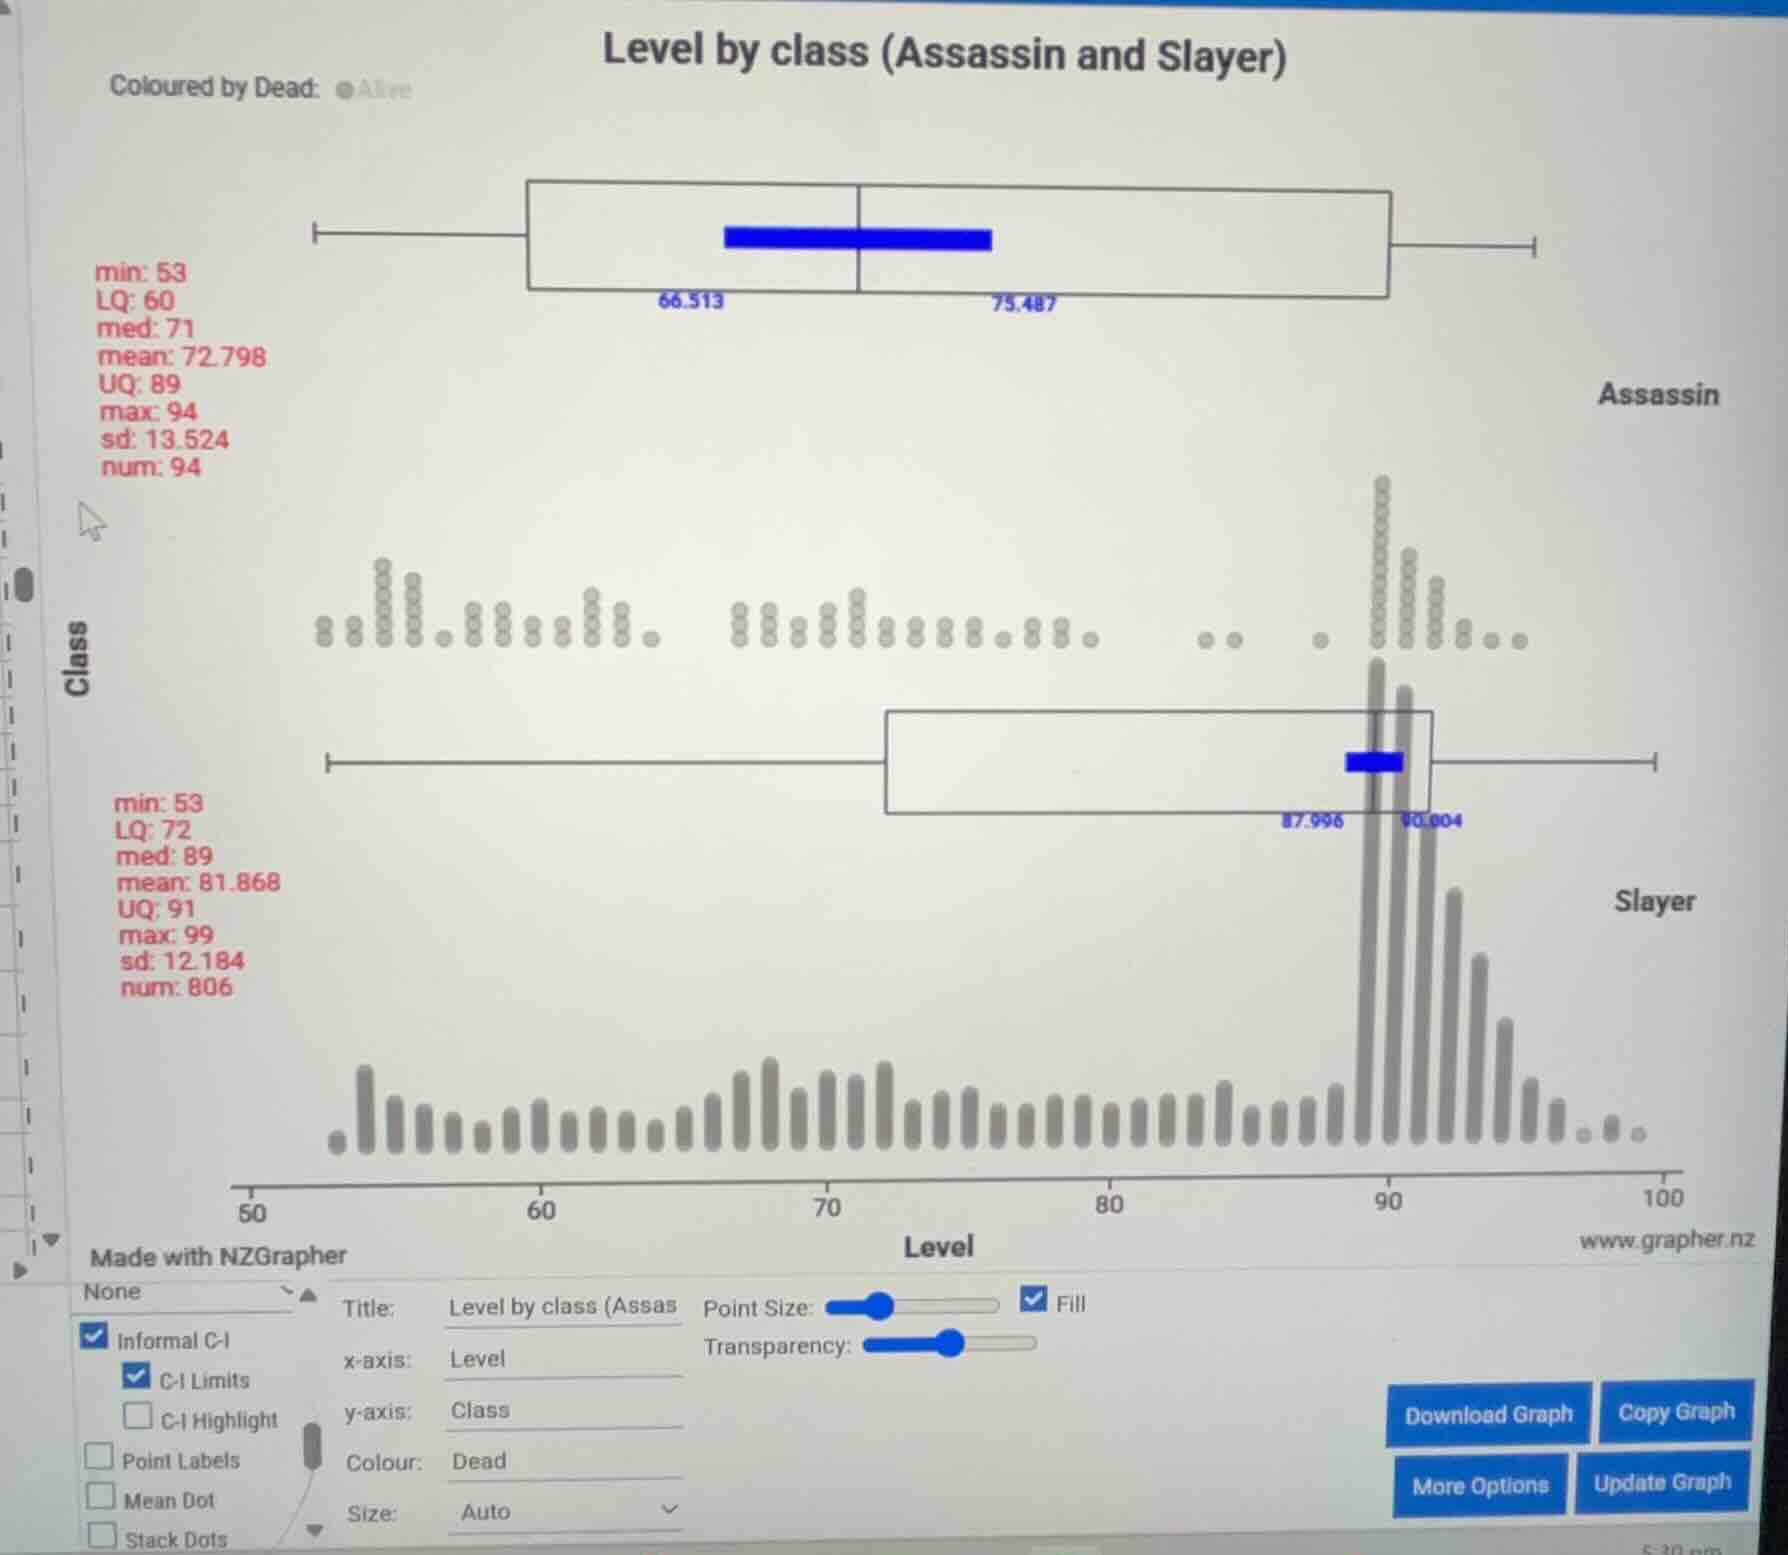
Identify the statistical summaries
We extract the key statistics for both classes from the provided NZGrapher output:
Assassin:
- Minimum (\(\text{min}\)): \(53\)
- Lower Quartile (\(\text{LQ}\)): \(60\)
- Median (\(\text{med}\)): \(71\)
- Mean: \(72.798\)
- Upper Quartile (\(\text{UQ}\)): \(89\)
- Maximum (\(\text{max}\)): \(94\)
- Standard Deviation (\(\text{sd}\)): \(13.524\)
- Sample Size (\(\text{num}\)): \(94\)
- Informal Confidence Interval (C-I) for the median: \([66.513, 75.487]\)
Slayer:
- Minimum (\(\text{min}\)): \(53\)
- Lower Quartile (\(\text{LQ}\)): \(72\)
- Median (\(\text{med}\)): \(89\)
- Mean: \(81.868\)
- Upper Quartile (\(\text{UQ}\)): \(91\)
- Maximum (\(\text{max}\)): \(99\)
- Standard Deviation (\(\text{sd}\)): \(12.184\)
- Sample Size (\(\text{num}\)): \(806\)
- Informal Confidence Interval (C-I) for the median: \([87.996, 90.004]\)
Compare the distributions
We compare the central tendency, spread, and shape of the two distributions:
- Center: The median level for Slayers (\(89\)) is significantly higher than the median level for Assassins (\(71\)).
- Spread: The Interquartile Range (\(\text{IQR}\)) for Assassins is \(\text{UQ} - \text{LQ} = 89 - 60 = 29\), while the \(\text{IQR}\) for Slayers is \(91 - 72 = 19\). This shows that the middle \(50\%\) of Assassin levels is more spread out than that of Slayers.
- Overlap: The informal confidence intervals for the median levels are \([66.513, 75.487]\) for Assassins and \([87.996, 90.004]\) for Slayers. These intervals do not overlap.
Formulate the statistical conclusion
Since the informal confidence intervals for the median levels of Assassins and Slayers do not overlap, we can make a formal statistical claim. We can conclude with confidence that back in the population, the median level of Slayers is higher than the median level of Assassins.

Snap & solve any problem in the app
Get step-by-step solutions on Sovi AI
Photo-based solutions with guided steps
Explore more problems and detailed explanations
Based on the statistical analysis of the NZGrapher output:
- Medians: The median level for Slayers (\(89\)) is higher than the median level for Assassins (\(71\)).
- Spread (IQR): The levels of Assassins (\(\text{IQR} = 29\)) are more spread out in the middle \(50\%\) compared to Slayers (\(\text{IQR} = 19\)).
- Informal Confidence Intervals:
- Assassin median confidence interval: \([66.513, 75.487]\)
- Slayer median confidence interval: \([87.996, 90.004]\)
Conclusion:
Because the informal confidence intervals for the medians do not overlap, we can make a claim that back in the population, the median level of Slayers is higher than the median level of Assassins.