QUESTION IMAGE
Question
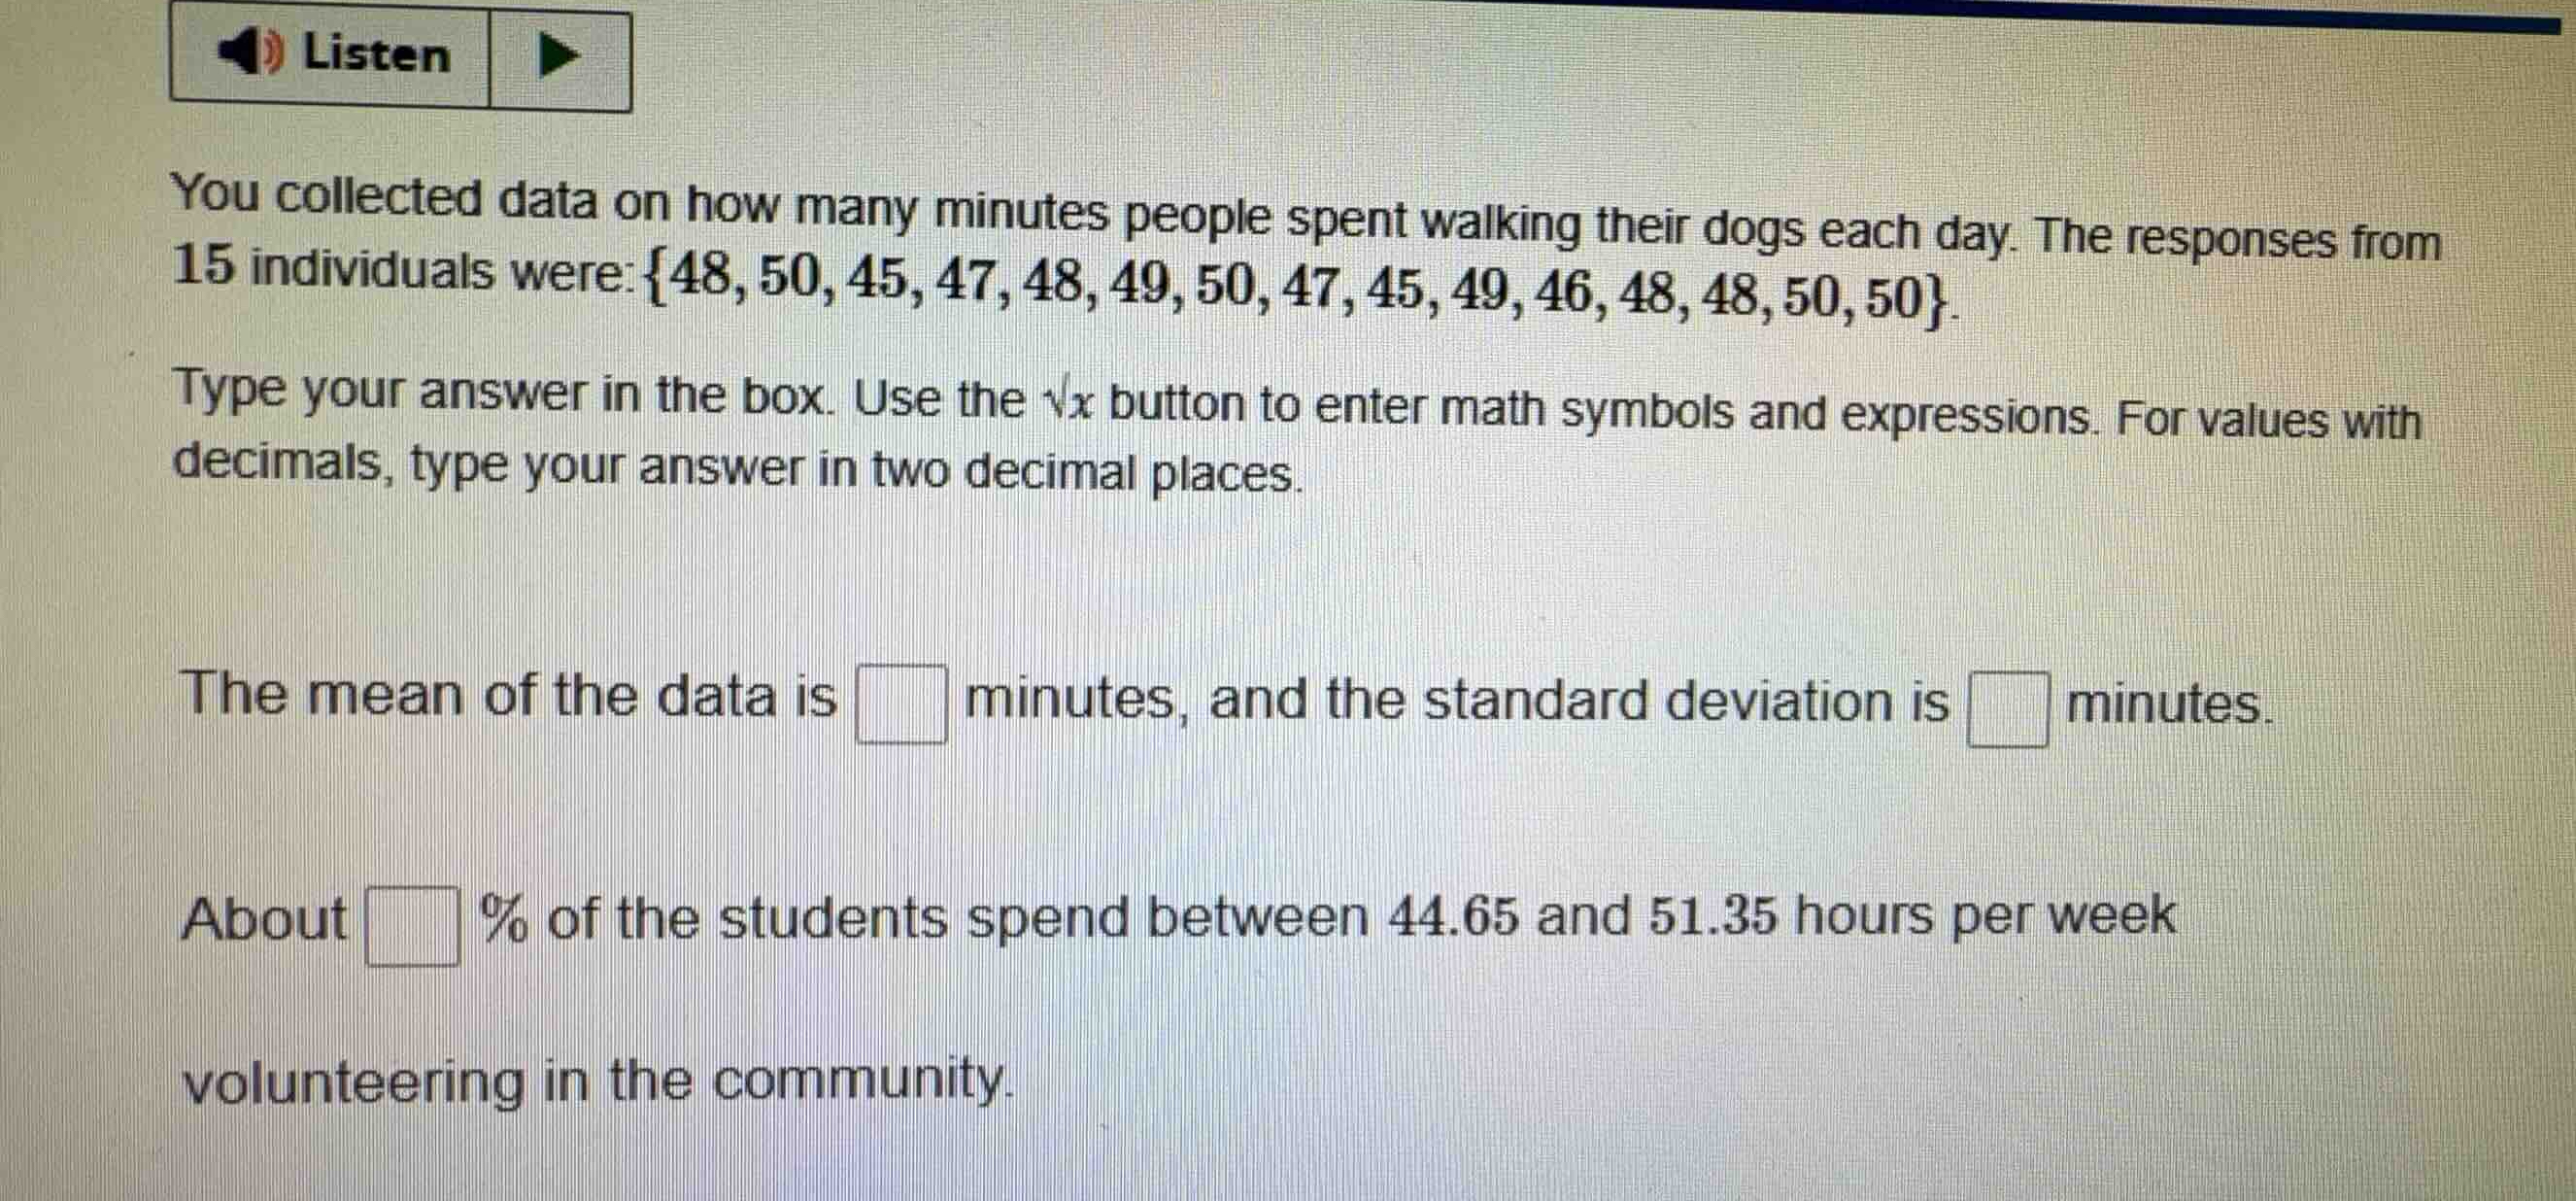
you collected data on how many minutes people spent walking their dogs each day. the responses from 15 individuals were: \\{48, 50, 45, 47, 48, 49, 50, 47, 45, 49, 46, 48, 48, 50, 50\\}.
type your answer in the box. use the \\(\sqrt{x}\\) button to enter math symbols and expressions. for values with decimals, type your answer in two decimal places.
the mean of the data is minutes, and the standard deviation is minutes.
about \\% of the students spend between 44.65 and 51.35 hours per week volunteering in the community.
Calculate the sample mean
Using the Sample Mean knowledge point
The dataset consists of \(n = 15\) values:
Sum of the values:
Mean:
Calculate the sample standard deviation
Find the squared differences from the mean \(\bar{x} = 48\):
Sample variance:
Sample standard deviation:
Determine the percentage within the interval
The second question asks about the percentage of students spending between \(44.65\) and \(51.35\) hours.
We calculate the number of standard deviations from the mean:
Using the Empirical Rule, approximately \(95\%\) of the data falls within \(2\) standard deviations of the mean.

Snap & solve any problem in the app
Get step-by-step solutions on Sovi AI
Photo-based solutions with guided steps
Explore more problems and detailed explanations
You collected data on how many minutes people spent walking their dogs each day. The responses from 15 individuals were: \(\{48, 50, 45, 47, 48, 49, 50, 47, 45, 49, 46, 48, 48, 50, 50\}\).
Type your answer in the box. Use the \(\sqrt{x}\) button to enter math symbols and expressions. For values with decimals, type your answer in two decimal places.
The mean of the data is <blank>48</blank> minutes, and the standard deviation is <blank>1.73</blank> minutes.
About <blank>95</blank> % of the students spend between 44.65 and 51.35 hours per week volunteering in the community.